OPEN-SOURCE SCRIPT
Hashem OBV+EMA/MA
Updated
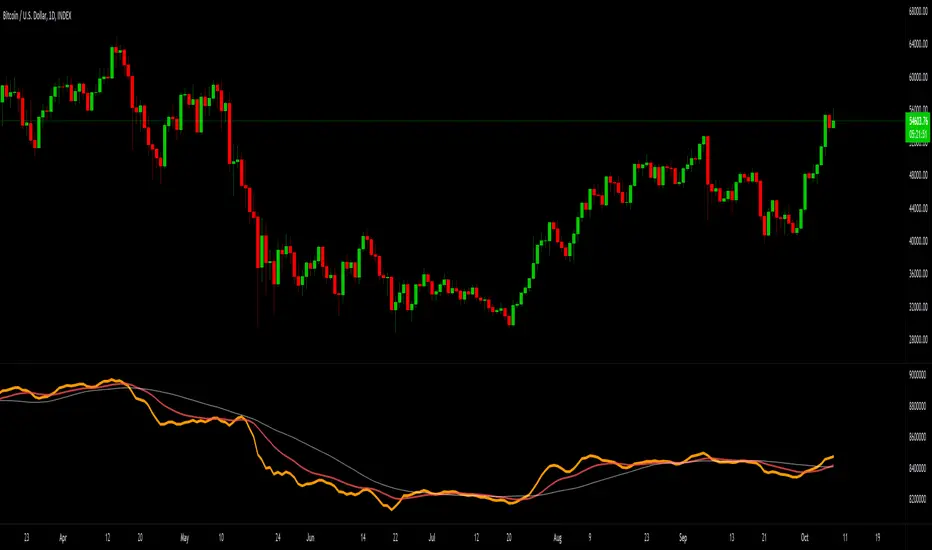
The On Balance Volume indicator (OBV) is used to measure buying and selling pressure.
It is a cumulative indicator meaning that on days where price went up, that day's volume is added to the cumulative OBV total. If price went down, then that day's volume is subtracted from the OBV total.
The OBV value is then plotted as a line for easy interpretation. OBV is primarily used to confirm or identify overall price Trends or to anticipate price movements after Divergences.
In addition to OBV, EMA and SMA are included. the EMA is used for Support and Resistances for the OBV. and the SMA is used by its Slope (can be S/R as well).
Release Notes
Added Divergences Lines on the OBV Line.(The Divergence Must be Confirmed First on the Price Action / Local Low or Local High Confirmation)
Green = Regular Bullish Divergence
Red = Regular Bearish Divergence
Aqua = Hidden Bullish Divergence
Purple = Hidden Bullish Divergence
Release Notes
Bug Fixes.Release Notes
Removed the UpdateRelease Notes
Added Smoothing.Release Notes
Code Tweak.Release Notes
Updated Code.Release Notes
Updated to v5 Pinescript.Without Risk and Position Management, You WILL Lose Money.
Open-source script
In true TradingView spirit, the author of this script has published it open-source, so traders can understand and verify it. Cheers to the author! You may use it for free, but reuse of this code in publication is governed by House rules. You can favorite it to use it on a chart.
Disclaimer
The information and publications are not meant to be, and do not constitute, financial, investment, trading, or other types of advice or recommendations supplied or endorsed by TradingView. Read more in the Terms of Use.