OPEN-SOURCE SCRIPT
Cumulative Delta Volume
Updated
Hello Traders,
This is Cumulative Delta Volume script. Delta refers to the difference between buying and selling volume at each price level. Cumulative Delta builds upon this concept by recording a cumulative tally of these differences in buying vs selling volume. The Cumulative Delta indicator plots as candlesticks or line. One of the main uses of Cumulative Delta is to confirm or deny market trends. you may need to search it for yourself ;)
You have option to see it as Candles or a Line. also there are options to show 2 SMAs and 2 EMAs with different Lengths, you can set the lengths as you wish.
By default it shows CDV as Heikin Ashi Candles, it can also show it as normal candles:

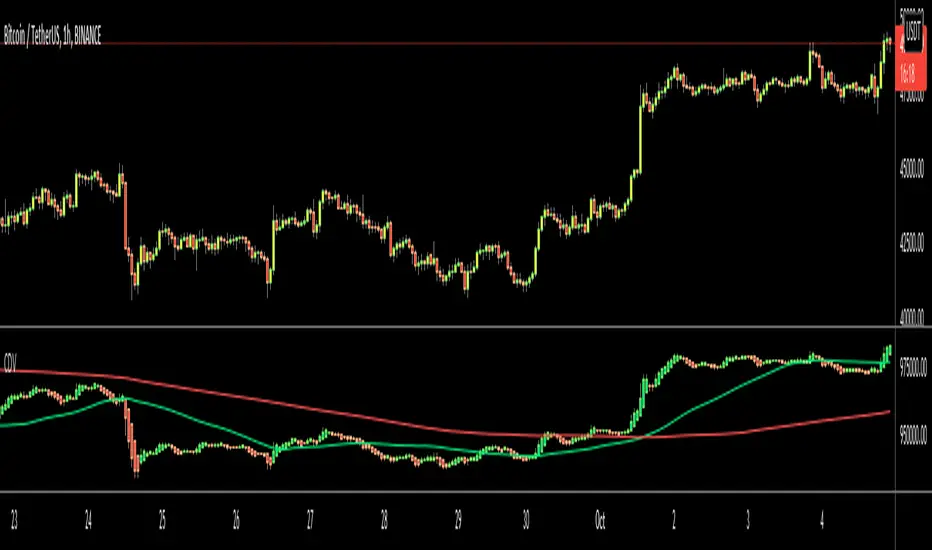
It can show CDV as a line:

Also you may need to check divergence:

Enjoy!
This is Cumulative Delta Volume script. Delta refers to the difference between buying and selling volume at each price level. Cumulative Delta builds upon this concept by recording a cumulative tally of these differences in buying vs selling volume. The Cumulative Delta indicator plots as candlesticks or line. One of the main uses of Cumulative Delta is to confirm or deny market trends. you may need to search it for yourself ;)
You have option to see it as Candles or a Line. also there are options to show 2 SMAs and 2 EMAs with different Lengths, you can set the lengths as you wish.
By default it shows CDV as Heikin Ashi Candles, it can also show it as normal candles:
It can show CDV as a line:
Also you may need to check divergence:
Enjoy!
Release Notes
options organizedcolor options added to candle body, border and wicks
color options added for moving averages
Release Notes
colors fixedOpen-source script
In true TradingView spirit, the author of this script has published it open-source, so traders can understand and verify it. Cheers to the author! You may use it for free, but reuse of this code in publication is governed by House rules. You can favorite it to use it on a chart.
Disclaimer
The information and publications are not meant to be, and do not constitute, financial, investment, trading, or other types of advice or recommendations supplied or endorsed by TradingView. Read more in the Terms of Use.