OPEN-SOURCE SCRIPT
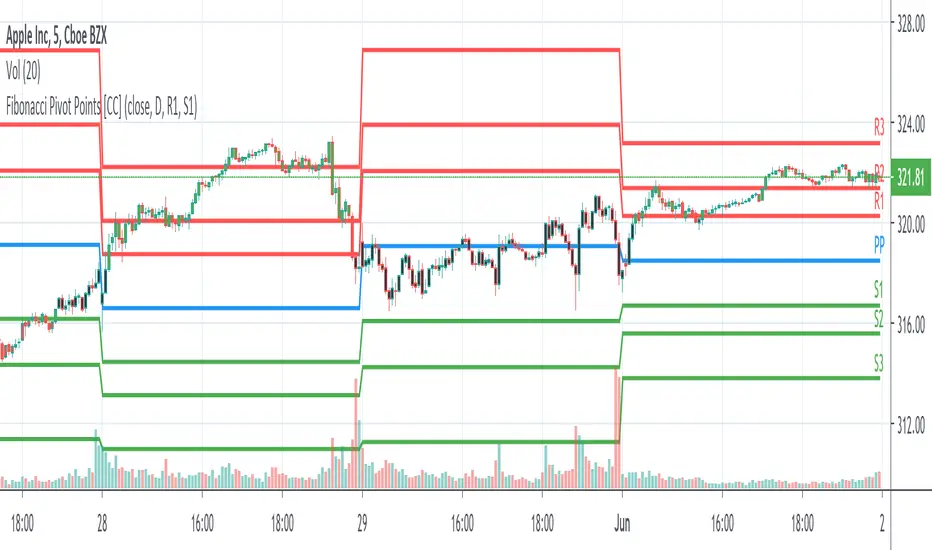
Fibonacci Pivot Points
Updated

I have included the main support and resistance pivot point levels for the Fibonacci Pivot Points. I changed the bar colors to reflect buy and sell points so if a bar is green then that means to buy it and if it is red then sell it
Let me know if you would like to see me do any other indicators!
Let me know if you would like to see me do any other indicators!
Release Notes
changed default values so you can change the default timeframeRelease Notes
updated to match my other indicatorsRelease Notes
updated buy and sell signals so that bar color changesRelease Notes
added labels and pivot pointRelease Notes
fixed small issueRelease Notes
fixed bar color issueRelease Notes
removed repainting option since it isn't needed for pivot points since pivots only use the previous bar for calculationsOpen-source script
In true TradingView spirit, the author of this script has published it open-source, so traders can understand and verify it. Cheers to the author! You may use it for free, but reuse of this code in publication is governed by House rules. You can favorite it to use it on a chart.
I created the largest stock indicator library:
github.com/ooples/
Custom Indicator Requests:
forms.gle/ouMffZR3dQ8bSJQG7
Tips are appreciated:
paypal.me/cheatcountry
patreon.com/cheatcountry
github.com/ooples/
Custom Indicator Requests:
forms.gle/ouMffZR3dQ8bSJQG7
Tips are appreciated:
paypal.me/cheatcountry
patreon.com/cheatcountry
Disclaimer
The information and publications are not meant to be, and do not constitute, financial, investment, trading, or other types of advice or recommendations supplied or endorsed by TradingView. Read more in the Terms of Use.