OPEN-SOURCE SCRIPT
SweetSweetLucia: OnceADay
Updated

Updated:
Thanks
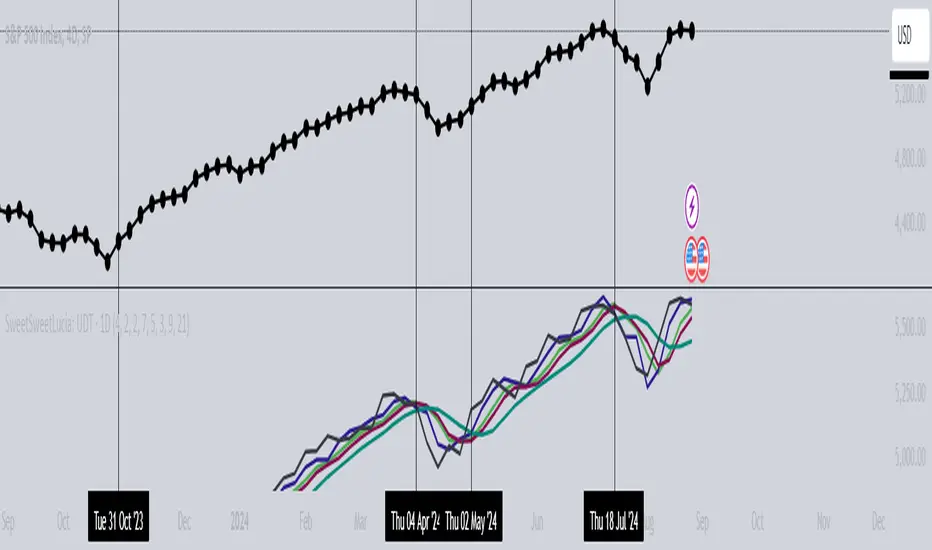
- 3 Bar Typical Price (Offset 1 Bar)
1 Bar Open Price
Crosses are Opening Crossings of Typical Price
Squares are Intraday Close over Typical Price
Line Graph is Close, with colors
Short, Medium, and Large Fractal Wave Moving Averages
Format is Price Action
Thanks
Release Notes
Updated:- 3 Bar Typical Price (Offset 1 Bar)
- 1 Bar Open Price
- Crosses are Opening Crossings of Typical Price
- Squares are Intraday Close over Typical Price
- Line Graph is Close, with colors
- Short, Medium, and Large Fractal Wave Moving Averages
- Format is Price Action
Thanks
Release Notes
Updated:- 3 Bar Typical Price (Offset 2 Bar)
- 1 Bar Open Price
- Crosses are Opening Crossings of Typical Price
- Squares are Intraday Close over Typical Price
- Line Graph is Close, with colors
- Short, Medium, and Large Fractal Wave Moving Averages
- Format is Price Action
Thanks
Release Notes
Updated:- 3 Bar Typical Price (Offset 1 Bar)
- 1 Bar Open Price
- Crosses are Opening Crossings of Typical Price
- Squares are Intraday Close over Typical Price
- Line Graph is Close, with colors
- Short, Medium, and Large Fractal Wave Moving Averages
- Format is Price Action
Thanks
Release Notes
**The Update**Has weight, smoothing, and transform.
The signals are more accurate.
The setting shouldn't be changed.
Trade it like a "Drummond Line," with opening psychology and closing violations.
If the indicator shows bullish psychology but the price returns to the range, close the trade;
it would demonstrate bar over bar divergence.
I wouldn't release this version but my previous version was faulty.
This 3.0 edition is years of research in the making.
Cross Symbols: Opening Sentiment Signals (Bullish or Bearish).
Square Symbols: Pivot Crossings (Support or Resistance).
Trendline: Instantaneous Trendline (21 Bars Transform).
Typical Priceline: Drummond or Pivot (Transform).
Opening-line: Psychological Sentiment (Transform).
Thanks,
privatepizza111
Release Notes
*******Release Notes
ThanksRelease Notes
For Crypto: Change the Precision in the gui menuRelease Notes
**Offset Update**Release Notes
**TRANSFORM UPDATE**Release Notes
**Graphics Update**Release Notes
**Graphics Update**Release Notes
**Settings Update**Release Notes
**Added Line Chart**Release Notes
**Offset Update**Release Notes
**Syntax Update****New Trendline Crossings**
Release Notes
**Update**Imaginary crossover and crossunder...(reversed)
Release Notes
**Crossing UpdatesRelease Notes
**Exponential Streams****User Friendly Color Changes**
**Notice the closing price line averages above or below the opening averages**
Release Notes
** Final Version with last GUI update**Release Notes
"Drummond" UpdateRelease Notes
Remove DuplicatesRelease Notes
// a psychological sentiment indicator// Digital Signal Processing
// For Crypto: Change the Precision in the gui menu
//a new update with methods, extracted calls, and requested securities...I would confirm barstates but the menu would become too clustered.
//this method of s-poles and z-poles lags through the s-poles but it is valid...I altered the technique to this application,
//for a psychological indicator...the original MA filters in found in Rocket Science by Ehlers.
Release Notes
fix typo releaseRelease Notes
a new update with methods, extracted calls, confirm barstates (else all unconfirmed is blue color), and requested securities.//this method of s-poles and z-poles lags through the s-poles but it is valid...I altered the technique to this application,
//for a psychological indicator...the original MA filters theory (not code) is found in Rocket Science by Ehlers.
Release Notes
color glitch update...and type updatesRelease Notes
request security updateRelease Notes
whitespace updateRelease Notes
*more extracted calls*Release Notes
Crossing bug update and typo update.Release Notes
Whitespace update and colors update...plus forced indexes update.Release Notes
Updated "color blue" and added nz types.Release Notes
update data paneRelease Notes
Newer: with tuples, labels, more inputs, new alias for concepts, priceline average, and so on.Release Notes
//15 April 2024//updated indicator with udt, udt maps, and the ram pointers of udt objects.
//inputs remained unchange because of series int and the simple int required from user inputs for the lengths.
//the methods were moved into the udt maps, functions and all.
//the request sources are in a map...'maps are the future'
//the symbols are displayed with labels for 'plot' not plot to plot them, labels save ram...labels are considered better,
//the changes are new:
// a psychological sentiment indicator
// Digital Signal Processing
// For Crypto: Change the Precision in the gui menu
Release Notes
//pulled the sources out of the map...the map had index errors.Release Notes
label position updateRelease Notes
crypto labels work with decimals now.Release Notes
Removed the shapes/labels...they were confusing.Added the line graph...also removed an unused variable.
Added multiple timeframes.
The quantizer remains unrounded for decimal values, $0.55 is rounded to $1.00 but $0.45 rounds to $0.00 and that is no good.
Release Notes
Removed the shapes/labels...they were confusing.Added the line graph...also removed an unused variable.
Added multiple timeframes.
The quantizer remains unrounded for decimal values, $0.55 is rounded to $1.00 but $0.45 rounds to $0.00 and that is no good.
Release Notes
Removed the shapes/labels...they were confusing.Added the line graph...also removed an unused variable.
Added multiple timeframes.
The quantizer remains unrounded for decimal values, $0.55 is rounded to $1.00 but $0.45 rounds to $0.00 and that is no good.
Open-source script
In true TradingView spirit, the author of this script has published it open-source, so traders can understand and verify it. Cheers to the author! You may use it for free, but reuse of this code in publication is governed by House rules. You can favorite it to use it on a chart.
Disclaimer
The information and publications are not meant to be, and do not constitute, financial, investment, trading, or other types of advice or recommendations supplied or endorsed by TradingView. Read more in the Terms of Use.