OPEN-SOURCE SCRIPT
Market Movers: Sectoral Index
Updated
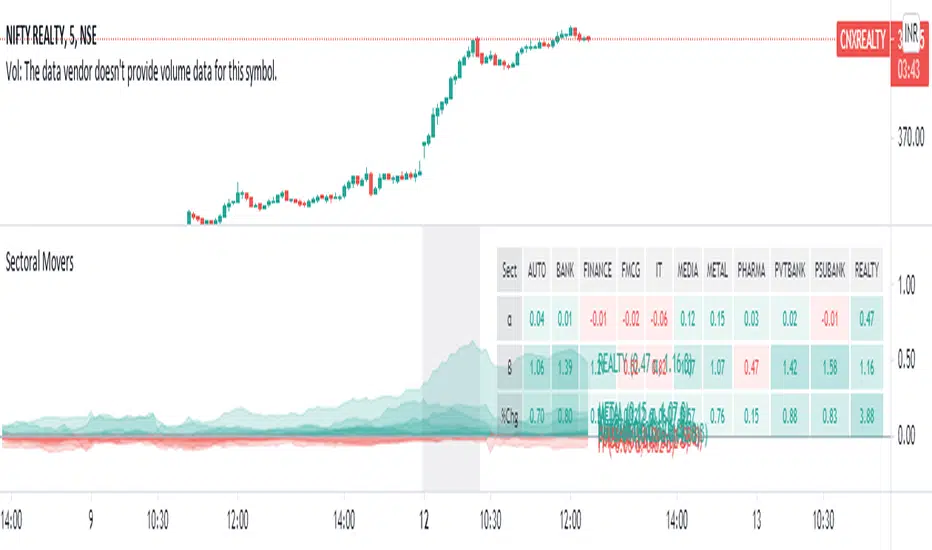
The indicator will show the Sectors which are leading or lagging NIFTY50 index based on Alpha & Beta values. Stock selection can be done based on the respective Sectors.
- Look for alpha & beta values.
- Prefer one with high beta.
- Greens are leaders & Blues are lagers.
- This don't completely indicates a trend, but it can give the overview of a major trend & market movers.
- Gray line is the base index NIFTY50, it is Zero.
- Turn on Indicator Name Label in Settings > Chart Settings.
- In intraday or positions, in a leading Sector there will be a leading stock, spot it out.
- Make a sector wise watchlist of stocks.
- Use higher or Daily timeframe for Swing trades.
- Detailed descriptions are available in my previous Alpha & Beta indicators.
Release Notes
Update v1.1Added table.
Changed color scheme.
Release Notes
Update v1.2Day Start Marker color choice.
Simplified menu.
Avoided Labels and Tables show/hide option as it is available in the Style tab.
Release Notes
Update v1.3- Included day % change in the table.
Release Notes
Updated on 24 July 2022- Bug fix
Release Notes
Updated on 24 July 2022- Bug fix
Open-source script
In true TradingView spirit, the author of this script has published it open-source, so traders can understand and verify it. Cheers to the author! You may use it for free, but reuse of this code in publication is governed by House rules. You can favorite it to use it on a chart.
Disclaimer
The information and publications are not meant to be, and do not constitute, financial, investment, trading, or other types of advice or recommendations supplied or endorsed by TradingView. Read more in the Terms of Use.