PROTECTED SOURCE SCRIPT
LCS/HCR Support and Resistance multi timeframes
Updated
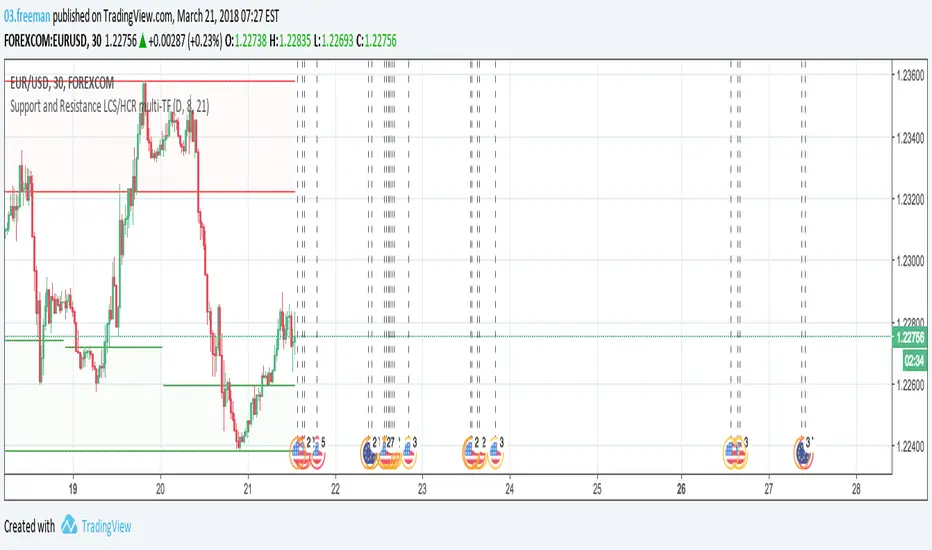
This study draws LCS and HCR lines for multi time frames and helps to find important support and resistance levels on lower timeframes.
Levels are based on close price and not low and high.
Levels are based on close price and not low and high.
Release Notes
Updated the scale because scale.none created some misallignment of supports and resistance lines.Disclaimer
The information and publications are not meant to be, and do not constitute, financial, investment, trading, or other types of advice or recommendations supplied or endorsed by TradingView. Read more in the Terms of Use.