OPEN-SOURCE SCRIPT
DEMA Strategy with MACD
The Double Exponential Moving Average (DEMA) indicator was introduced in January 1994 by Patrick G. Mulloy, in an article in the "Technical Analysis of Stocks & Commodities" magazine: "Smoothing Data with Faster Moving Averages"
It attempts to remove the inherent lag associated to Moving Averages by placing more weight on recent values. The name suggests this is achieved by applying a double exponential smoothing which is not the case. The name double comes from the fact that the value of an EMA (Exponential Moving Average) is doubled. To keep it in line with the actual data and to remove the lag the value "EMA of EMA" is subtracted from the previously doubled ema.
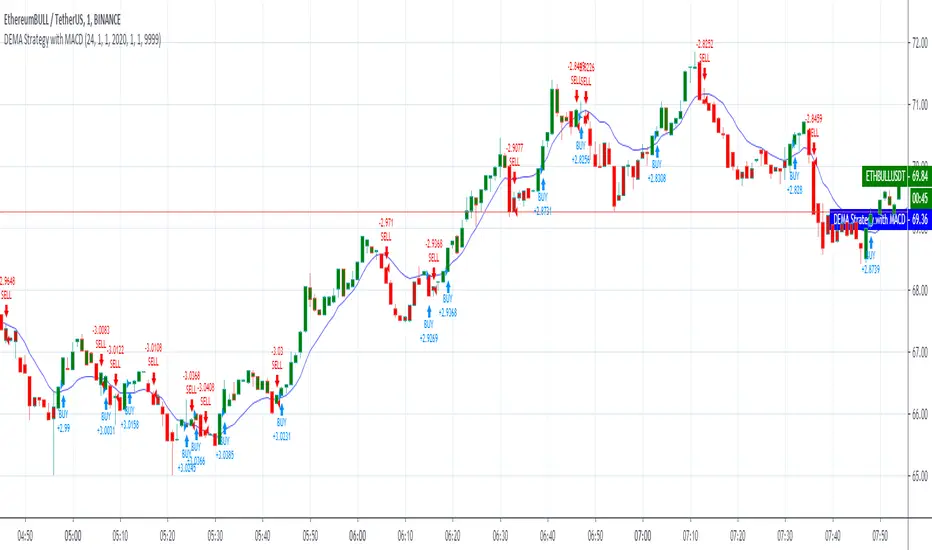
DEMA is a very responsive system. A lot of signals can be generated only when trading with DEMA. In this strategy, I combined Dema buy-sell signals with MACD indicator. When you activate MACD confirmation from settings; When DEMA comes to long situation, the MACD histogram is checked to be positive.
It attempts to remove the inherent lag associated to Moving Averages by placing more weight on recent values. The name suggests this is achieved by applying a double exponential smoothing which is not the case. The name double comes from the fact that the value of an EMA (Exponential Moving Average) is doubled. To keep it in line with the actual data and to remove the lag the value "EMA of EMA" is subtracted from the previously doubled ema.
DEMA is a very responsive system. A lot of signals can be generated only when trading with DEMA. In this strategy, I combined Dema buy-sell signals with MACD indicator. When you activate MACD confirmation from settings; When DEMA comes to long situation, the MACD histogram is checked to be positive.
Open-source script
In true TradingView spirit, the author of this script has published it open-source, so traders can understand and verify it. Cheers to the author! You may use it for free, but reuse of this code in publication is governed by House rules. You can favorite it to use it on a chart.
Disclaimer
The information and publications are not meant to be, and do not constitute, financial, investment, trading, or other types of advice or recommendations supplied or endorsed by TradingView. Read more in the Terms of Use.