PROTECTED SOURCE SCRIPT
NIFTY POSITION Scanner
Updated

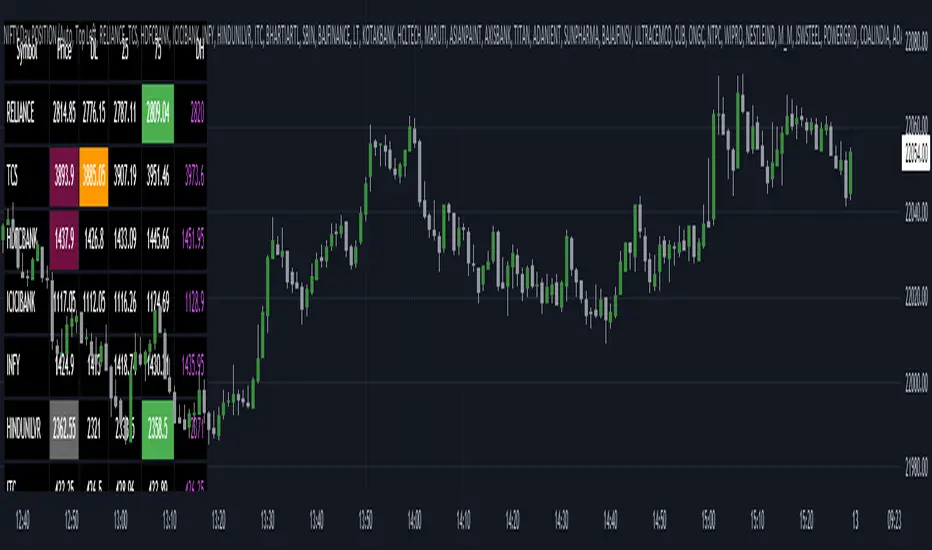
Tracking the real-time intraday position of NIFTY stocks is the utility of this price action based scanner. The number of stocks in this scanner is 40 due to TradingView's script limit.
The script takes present day's price range of the stocks (stocks of the Index being tracked included in this screener) into account, to hint strength or weakness in the underlying Index (for example: NIFTY here).
The day's price range of a stock is gauged on a scale of 0-100, where 0 is Day's price low and 100 is day's price high.
If a stock is in 90-100 price range section the cell with title "90" illuminates hinting the stock is trading near day's high.
Likewise, if a stock is in 0-10 price range section the cell with title "10" illuminates hinting that the stock is trading near day's low.
The price range of 10-25 is represented in the cell titled "25"
The price range of 75-90 is represented in the cell titled "75"
Only one cell from the day's range illuminates at a time for a stock, signaling the present position of that stock in the Day's range at that instant.
The script works best above 10 second time frame.
Idea: If majority of the heavy weight stocks of the Index being tracked are trading near Day's high the underlying Index must be going strong at that very instant and Vice versa.
Disclaimer: Only for studying Index movement ideas intraday, trading is not advised.
Also check out the other scripts by me.
-- Dr. Vats
Release Notes
Included the real-time price position relative to Previous Day High/Low [PDHL] in this update.If present price is above PDH of the stock the Price cell illuminates to gray.
If present price is below PDL of the stock the Price cell illuminates to maroon.
Release Notes
Visibility improvements.User can also change the stocks in the position scanner from the settings menu as per user's watchlist preferences.
DM contact: x.com/TathaastuVats
Telegram: t.me/simplya
Explainer YouTube: youtube.com/channel/UCIKgUNfoe5dZQIX_ZpBt_iQ
Telegram: t.me/simplya
Explainer YouTube: youtube.com/channel/UCIKgUNfoe5dZQIX_ZpBt_iQ
Disclaimer
The information and publications are not meant to be, and do not constitute, financial, investment, trading, or other types of advice or recommendations supplied or endorsed by TradingView. Read more in the Terms of Use.

