OPEN-SOURCE SCRIPT
Non Adaptive Moving Average - Quan Dao
Updated

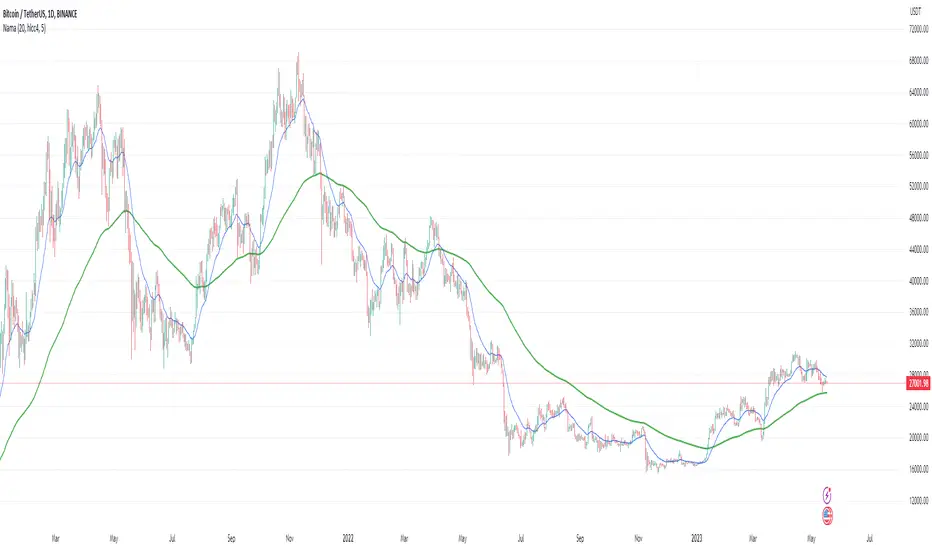
This Non-Adaptive Moving Average (NAMA) is my origin work. It came from the issues that I always face when using existing famous MA like EMA or RMA:
- What length should I choose for the MA for this security?
- Is there a length that works for multiple timeframes?
- Is there a length that works for multiple securities in multiple markets?
Choosing the right length for an MA is a tedious and boring work and is very subjective. One day in early 2023, I decided to create a new MA that will not be dependant a lot (non-adaptive) on the length of it, to make my life a little bit easier. The idea came from the formula of EMA and RMA:
ma = alpha * src + (1 - alpha) * ma[1]
in which,
alpha = 1 / length for RMA
alpha = 2 / (length + 1) for EMA
I decided to use a constant alpha for the formula, which happened to be: 1.618 / 100 (i.e., golden ratio / 100)
This NAMA is using the length in the start only, after running for a while the MA value will be the same for every value of its length, which resolves good my 3 questions above.
The application of this NAMA is wide, I think.
- It can be used like a normal MA but you don't have to choose its length anymore.
- It can be used like EMA in DEMA, TEMA (I called it DNAMA, TNAMA)
- It can be used in calculating some famous indicators (RSI, TR, ...) so that these indicators will not be dependant on the length as well
In this example script, I included an EMA (in blue color) as well so that you can see how the EMA changes and NAMA stays the same when changing the value of its Length.
Release Notes
Update chart.Release Notes
Supported multi-timeframe now.Open-source script
In true TradingView spirit, the author of this script has published it open-source, so traders can understand and verify it. Cheers to the author! You may use it for free, but reuse of this code in publication is governed by House rules. You can favorite it to use it on a chart.
Disclaimer
The information and publications are not meant to be, and do not constitute, financial, investment, trading, or other types of advice or recommendations supplied or endorsed by TradingView. Read more in the Terms of Use.