OPEN-SOURCE SCRIPT
Ichimoku + 2 base lines
Updated
Ichimoku + 2 base line
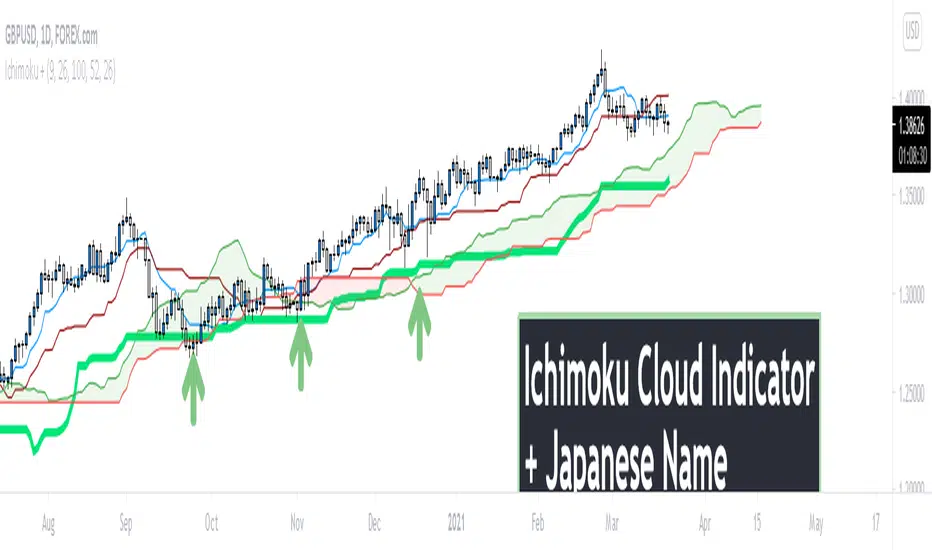
This indicator is a combination of Ichimoku cloud indicator with two base lines.
The first base line is the same as the Ichimoku default settings but the baseline 2 indicates an average of 108 candles in the past and it acts as a strong support and resistance level.
How to use this indicator?
Caution: before using this indicator please back test it and if the results were good enough, use it as a confirmation.
This indicator is a combination of Ichimoku cloud indicator with two base lines.
The first base line is the same as the Ichimoku default settings but the baseline 2 indicates an average of 108 candles in the past and it acts as a strong support and resistance level.
How to use this indicator?
- You can use this indicator to see if a break out is true or is a false break. For example if the price broke up the Ichimoku cloud and base line 2 is above the price, it will probably react to that area but if it's below the price, it is a good opportunity to buy. (for sell/short position it is in the opposite way the base line 2 should be above the price)
- If you want to trade in support zones base line 2 (108) is a very good area that you can wait for a good candlestick pattern to enter a position.
Caution: before using this indicator please back test it and if the results were good enough, use it as a confirmation.
Release Notes
Japanese names added to the indicatorTelegram:
t.me/trade_magicians
You can contact me to order your personal indicator in PM or on Telegram: @trade_magicians
t.me/trade_magicians
You can contact me to order your personal indicator in PM or on Telegram: @trade_magicians
Open-source script
In true TradingView spirit, the author of this script has published it open-source, so traders can understand and verify it. Cheers to the author! You may use it for free, but reuse of this code in publication is governed by House rules. You can favorite it to use it on a chart.
Disclaimer
The information and publications are not meant to be, and do not constitute, financial, investment, trading, or other types of advice or recommendations supplied or endorsed by TradingView. Read more in the Terms of Use.