OPEN-SOURCE SCRIPT
MTF Diagonally Layered RSI - 1 minute Bitcoin Bot [wbburgin]
Updated

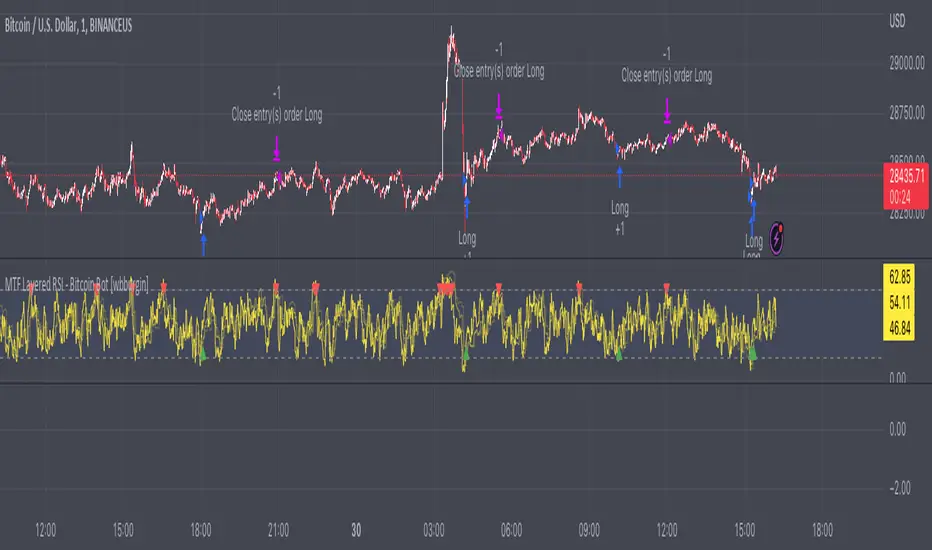
This is a NON-REPAINTING multi-timeframe RSI strategy (long-only) that enters a trade only when two higher timeframes are oversold. I wrote it on BTC/USD for 1min, but the logic should work on other assets as well. It is diagonally layered to be profitable for when the asset is in a downtrend.
Diagonal layering refers to entry and exit conditions spread across different timeframes. Normally, indicators can become unprofitable because in downtrends, the overbought zones of the current timeframe are not reached. Rather, the overbought zones of the faster timeframes are reached first, and then a selloff occurs. Diagonally-layered strategies mitigate this by selling diagonally, that is, selling once the faster timeframe reaches overbought and buying once the slower timeframe reaches oversold.
Thus this strategy is diagonally layered down. I may create a separate script that alternates between diagonal-up and diagonal-down based off of overall trend, as in extended trend periods up this indicator may not flash as frequently. This can be visualized in a time series x timeframe chart as an "X" shape. Something to consider...
Let me know if you like this strategy. Feel free to alter the pyramiding entries, initial capital, and entry size, as well as commission regime. My strategies are designed to maximize average profit instead of flashing super frequently, as the fees will eat you up. Additionally, at the time of publication, all of my strategy scripts are intended to have profitable Sharpe and Sortino ratios.
Timeframes, RSI period, and oversold/overbought bounds are configurable.
Release Notes
Altered to align with Tradingview's method of non-repainting, see the link inside the script.Release Notes
Added another way to prevent repaint. The "Manual Calculation" will use the multiple between your current timeframe and your higher timeframes to calculate the RSI. Compare it with tradingview's default RSI - it is practically the same!I set this new RSI setting as default. It should not repaint at ALL now because all higher TF RSI's are being calculated from the group up using timeframe multiples.
Release Notes
Added short capabilities.Release Notes
Added timeframes above 4 hours to the manual calculation method.Release Notes
Changed tooltip message.Release Notes
Updated strat settings.Release Notes
I didn't have the input for the ema actually link to the ema calculation. Now it does.Release Notes
Option to go both long and short vs. just long is now in settings (for those in the comments wondering about changing the code).Release Notes
Added title to short trades.Open-source script
In true TradingView spirit, the author of this script has published it open-source, so traders can understand and verify it. Cheers to the author! You may use it for free, but reuse of this code in publication is governed by House rules. You can favorite it to use it on a chart.
FAQ: I am gradually phasing out my Patreon because of the time it takes to maintain.
BTC: 35PdMMMXFCvPjXKwn8wsRFNwMEPgStaKUJ
Test my strategies on CryptoRobotics: cryptorobotics.co/?trade=f23b09
BTC: 35PdMMMXFCvPjXKwn8wsRFNwMEPgStaKUJ
Test my strategies on CryptoRobotics: cryptorobotics.co/?trade=f23b09
Disclaimer
The information and publications are not meant to be, and do not constitute, financial, investment, trading, or other types of advice or recommendations supplied or endorsed by TradingView. Read more in the Terms of Use.