OPEN-SOURCE SCRIPT
RSI Bands, RSI %B and RSI Bandwidth
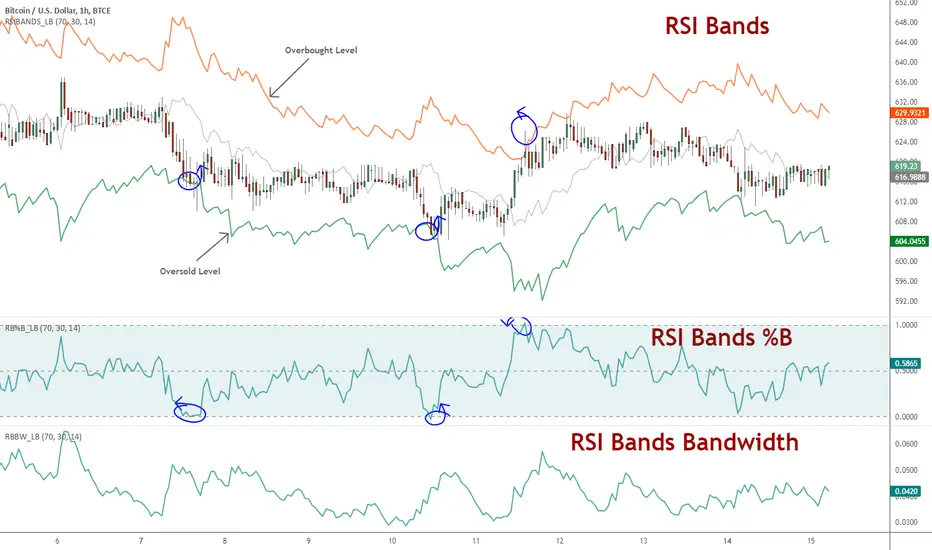
RSI bands provide an intuitive way of visualizing how the price movement causes RSI to move with in its range (0-100). Upper/Lower bands signify overbought and oversold levels respectively (Default: 70/30, you can customize them via options page). These bands closely match what Constance Brown explains in her book "Technical Analysis for the Trading Professional".
I have also coded up 2 scripts to visualize %B and Bandwidth, just as in BollingerBands. As you can see %B is equivalent to the actual RSI. Along with RSI_Bandwidth and %B, the bands convey a lot of information.
Another tip is to render Bollinger Bands along with RSIBands...endless possibilities :)
I have included all 3 scripts in the same chart, as they are all related. Since TradingView doesn't allow sharing more than one script in the same chart, you can only "Add script" RSI Bands.
If you want to use RSI %B and Bandwidth, follow this guide to "Make mine" this chart and get access to the source:
drive.google.com/file/d/0Bx48Du_2aPFncUhIemNrZUY1dTA/edit?usp=sharing
For the complete list of my indicators, check this post:
tradingview.com/v/4IneGo8h/
List of my free indicators: bit.ly/1LQaPK8
List of my indicators at Appstore: blog.tradingview.com/?p=970
List of my indicators at Appstore: blog.tradingview.com/?p=970
Open-source script
In true TradingView spirit, the author of this script has published it open-source, so traders can understand and verify it. Cheers to the author! You may use it for free, but reuse of this code in publication is governed by House rules. You can favorite it to use it on a chart.
Disclaimer
The information and publications are not meant to be, and do not constitute, financial, investment, trading, or other types of advice or recommendations supplied or endorsed by TradingView. Read more in the Terms of Use.