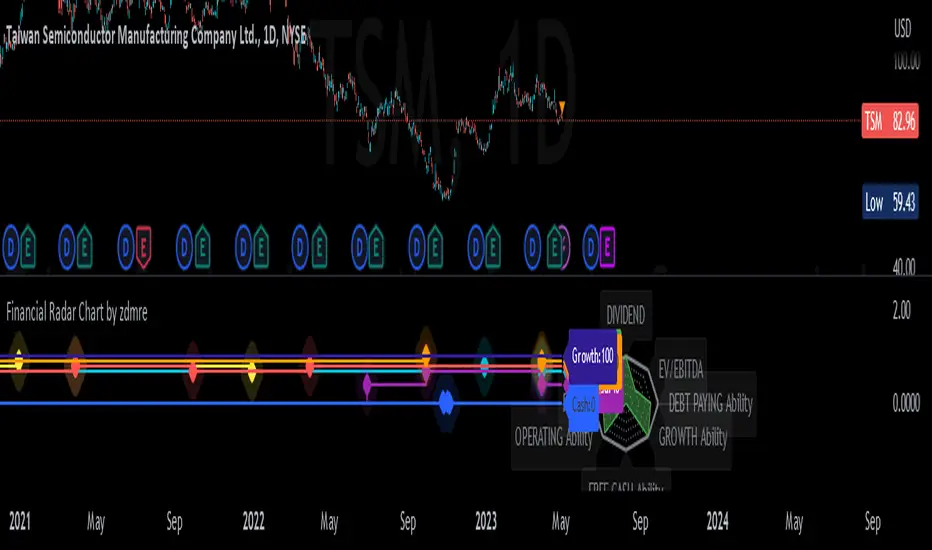
Financial Radar Chart by zdmreRadar chart is often used when you want to display data across several unique dimensions. Although there are exceptions, these dimensions are usually quantitative, and typically range from zero to a maximum value. Each dimension’s range is normalized to one another, so that when we draw our spider chart, the length of a line from zero to a dimension’s maximum value will be the similar for every dimension.
This Charts are useful for seeing which variables are scoring high or low within a dataset, making them ideal for displaying performance.
How is the score formed?
Debt Paying Ability
if Debt_to_Equity < %10 : 100
elif < 20% : 90
elif < 30% : 80
elif < 40% : 70
elif < 50% : 60
elif < 60% : 50
elif < 70% : 40
elif < 80% : 30
elif < 90% : 20
elif < 100% : 10
else: 0
ROIC
if Return_on_Invested_Capital > %50 : 100
elif > 40% : 90
elif > 30% : 80
elif > 20% : 70
elif > 10% : 50
elif > 5% : 20
else: 0
ROE
if Return_on_Equity > %50 : 100
elif > 40% : 90
elif > 30% : 80
elif > 20% : 70
elif > 10% : 50
elif > 5% : 20
else: 0
Operating Ability
if Operating_Margin > %50 : 100
elif > 30% : 90
elif > 20% : 80
elif > 15% : 60
elif > 10% : 40
elif > 0 : 20
else: 0
EV/EBITDA
if Enterprise_Value_to_EBITDA < 3 : 100
elif < 5 : 80
elif < 7 : 70
elif < 8 : 60
elif < 10 : 40
elif < 12 : 20
else: 0
FREE CASH Ability
if Price_to_Free_Cash_Flow < 5 : 100
elif < 7 : 90
elif < 10 : 80
elif < 16 : 60
elif < 18 : 50
elif < 20 : 40
elif < 22 : 30
elif < 30 : 20
elif < 40 : 15
elif < 50 : 10
elif < 60 : 5
else: 0
GROWTH Ability
if Revenue_One_Year_Growth > %20 : 100
elif > 16% : 90
elif > 14% : 80
elif > 12% : 70
elif > 10% : 50
elif > 7% : 40
elif > 4% : 30
elif > 2% : 20
elif > 0 : 10
else: 0
Spider
Multi Time Frame Normalized PriceEnhance Your Trading Experience with the Multi Time Frame Normalized Price Indicator
Introduction
As a trader, having a clear and informative chart is crucial for making informed decisions. In this post, we will introduce the Multi Time Frame Normalized Price (MTFNP) Indicator, an innovative trading tool that offers an insightful perspective on price action. The script creates a symmetric chart, with the time axis going from top to bottom, making it easier to identify potential tops and bottoms in various ranges. Let's dive deeper into this powerful tool to understand how it works and how it can improve your trading experience.
The Multi Time Frame Normalized Price Indicator
The MTFNP Indicator is designed to provide a comprehensive view of price action across multiple time frames. By plotting the normalized price levels for each time frame, traders can easily identify areas of support and resistance, as well as potential tops and bottoms in various ranges.
One of the key features of this indicator is the symmetry of the chart. Instead of the traditional horizontal time axis, the MTFNP Indicator plots the time axis vertically from top to bottom. This innovative approach makes it easier for traders to visualize the price action across different time frames, enabling them to make more informed decisions.
Benefits of a Symmetric Chart
There are several advantages to using a symmetric chart with a vertical time axis, such as:
Easier to read: The unique layout of the chart makes it easier to analyze price action across multiple time frames. The clear separation between each time frame helps traders avoid confusion and identify important price levels more effectively.
Identifying tops and bottoms: The symmetric presentation of price action enables traders to quickly spot potential tops and bottoms in various ranges. This can be particularly useful for identifying potential reversal points or areas of support and resistance.
Improved decision-making: By offering a comprehensive view of price action, the MTFNP Indicator helps traders make better-informed decisions. This can lead to improved trading strategies and ultimately, better results.
The MTFNP Indicator Script
The MTFNP Indicator script leverages several custom functions, including the Chebyshev Type I Moving Average, to provide a smooth and responsive signal. Additionally, the indicator uses the Spider Plot function to create a symmetric chart with the time axis going from top to bottom.
To customize the MTFNP Indicator to your preferences, you can adjust the input parameters, such as the standard deviation length, multiplier, axes color, bottom color, and top color. You can also change the scale to fit your desired chart size.
Exploring the Relationship between Min, Max Values and Time Frames
In the Multi Time Frame Normalized Price (MTFNP) script, it is crucial to understand the relationship between the min and max values across different time frames. By analyzing how these values relate to each other, traders can make more informed decisions about market trends and potential reversals. In this section, we will dive deep into the relationship between the current time frame's min and max values and those of the further-out time frames.
Interpreting Min and Max Values Across Time Frames
When analyzing the min and max values of the current time frame in relation to the further-out time frames, it is essential to keep in mind the following points:
All min values: If the current time frame and all further-out time frames have min values, this is a strong indication that the current price level is not just a local minimum. Instead, it is likely a more significant support level. In such cases, there is a higher probability that the price will bounce back upwards, making it a potentially favorable entry point for a long position.
All max values: Conversely, if the current time frame and all further-out time frames have max values, this suggests that the current price level is not just a local maximum. Instead, it is likely a more significant resistance level. In these situations, there is a higher probability that the price will reverse downwards, making it a potentially favorable entry point for a short position.
Neutral values with high current time frame: If the current time frame has a high value while the further-out time frames are more neutral, it could indicate that the trend may continue. This is because the high value in the current time frame may signify momentum in the market, whereas the neutral values in the further-out time frames suggest that the trend has not yet reached an extreme level. In this case, traders might consider following the trend and entering a position in the direction of the current movement.
Neutral values with low current time frame: If the current time frame has a low value while the further-out time frames are more neutral, it could indicate that the trend may reverse. This is because the low value in the current time frame may suggest a potential reversal point, whereas the neutral values in the further-out time frames imply that the trend has not yet reached an extreme level. In this case, traders might consider entering a counter-trend position, anticipating a potential reversal.
Balancing Different Time Frames for Optimal Decision Making
It is essential to remember that relying solely on min and max values across different time frames can lead to potential pitfalls. The market is influenced by a wide array of factors, and no single indicator or data point can provide a complete picture. To make the most informed decisions, traders should consider incorporating additional technical analysis tools and evaluating the overall market context.
Moreover, it is crucial to maintain a balance between the current time frame and the further-out time frames. While the current time frame provides information about the most recent market movements, the further-out time frames offer a broader perspective on the market's historical behavior. By combining insights from both types of time frames, traders can make more comprehensive assessments of potential opportunities and risks.
Conclusion
In conclusion, the Multi Time Frame Normalized Price (MTFNP) script offers traders valuable insights by analyzing the relationship between the current time frame and further-out time frames. By identifying potential trend reversals and continuations, traders can make better-informed decisions about market entry and exit points.
Understanding the relationship between min and max values across different time frames is an essential component of using the MTFNP script effectively. By carefully analyzing these relationships and incorporating additional technical analysis tools, traders can improve their decision-making process and enhance their overall trading strategy.
However, it is important to remember that relying solely on the MTFNP script or any single indicator can lead to potential pitfalls. The market is influenced by a wide array of factors, and no single indicator or data point can provide a complete picture. To make the most informed decisions, traders should consider using a combination of technical analysis tools, evaluating the overall market context, and maintaining a balance between the current time frame and the further-out time frames for a comprehensive understanding of the market's behavior. By doing so, they can increase their chances of success in the ever-changing and complex world of trading.

Forex RadarForex Radar Indicator: A Powerful Tool for Analyzing Currency Strength and Weakness
Introduction
The Forex Radar Indicator is an innovative tool that provides a visual representation of the relative strength and weakness of various currencies in the Forex market. This indicator is designed to help traders identify potential trading opportunities by analyzing the performance of different currency pairs. In this blog post, we will explore the features and benefits of the Forex Radar Indicator, and explain how to use it effectively in your trading strategy.
Features of the Forex Radar Indicator
1. Spider Plot Visualization
The Forex Radar Indicator uses a spider plot to display the relative strength and weakness of various currencies. A spider plot is a graphical representation of multivariate data, in which each variable is plotted on a separate axis that radiates from the center of the plot. The data points are connected by lines, forming a web-like pattern that makes it easy to compare the performance of different currencies.
2. Customizable Color Scheme
The Forex Radar Indicator allows users to customize the color scheme for each currency, making it easy to identify individual currencies on the spider plot. This feature can be particularly helpful for traders who prefer specific colors for each currency, or who want to use a color scheme that matches their trading platform or charting tools.
3. EMA Divergence and RSI Style Selection
The Forex Radar Indicator offers users the flexibility to choose between two different styles: EMA divergence and RSI. The EMA divergence style displays the difference between a short-term and long-term exponential moving average, while the RSI style shows the relative strength index of the currency pairs. By selecting the preferred style, traders can customize the indicator to suit their specific trading style and strategy.
4. Flexible Input Parameters
The Forex Radar Indicator offers flexible input parameters, allowing users to customize the indicator according to their trading preferences. These parameters include the length of the moving average, the filter value for the moving average, and the normalization length. By adjusting these parameters, traders can fine-tune the indicator to suit their specific trading style and strategy.
Using the Forex Radar Indicator in Your Trading Strategy
The Forex Radar Indicator can be a valuable tool in any trading strategy, as it provides a visual representation of the currency strength and weakness. Here are some tips on how to use the Forex Radar Indicator effectively in your trading:
1. Identify Currency Strength and Weakness
The main purpose of the Forex Radar Indicator is to help traders identify the strength and weakness of various currencies. By analyzing the spider plot, traders can quickly determine which currencies are performing well and which are underperforming. This information can be used to identify potential trading opportunities, as traders can focus on currency pairs that feature a strong currency against a weak one.
2. Choose Between EMA Divergence and RSI Style
Depending on your trading style and strategy, you can choose between the EMA divergence and RSI style options provided by the Forex Radar Indicator. Both styles offer valuable insights into currency strength and weakness, but they may highlight different aspects of the market. By selecting the style that best aligns with your trading approach, you can maximize the effectiveness of the indicator in your trading strategy.
3. Combine with Other Technical Analysis Tools
While the Forex Radar Indicator provides valuable insights into currency strength and weakness, it is important to remember that no single indicator can provide a complete picture of the market. To improve the accuracy and effectiveness of your trading strategy, consider combining the Forex Radar Indicator with other technical analysis tools, such as trend lines, support and resistance levels, and other indicators.
Conclusion
The Forex Radar Indicator is a powerful tool that can help traders gain a better understanding of the relative strength and weakness of various currencies in the Forex market. By incorporating the Forex Radar Indicator into your trading strategy, you can quickly identify potential trading opportunities and make more informed trading decisions. With its customizable color scheme, EMA divergence and RSI style options, and flexible input parameters, the Forex Radar Indicator is a versatile tool that can be adapted to suit any trading style or strategy.

Radar RiderThe Radar Rider indicator is a powerful tool that combines multiple technical indicators into a single spider plot, providing traders with a comprehensive view of market conditions. This article will delve into the workings of each built-in indicator and their arrangement within the spider plot. To better understand the structure of the script, let's first examine some of the primary functions and how they are utilized in the script.
Normalize Function: normalize(close, len)
The normalize function takes the close price and a length as arguments and normalizes the price data by scaling it between 0 and 1, making it easier to compare different indicators.
Exponential Moving Average (EMA) Filter: bes(source, alpha)
The EMA filter is used to smooth out data using an exponential moving average, with the given alpha value defining the level of smoothing. This helps reduce noise and enhance the trend-following characteristics of the indicators.
Maximum and Minimum Functions: max(src) and min(src)
These functions find the maximum and minimum values of the input data over a certain period, respectively. These values are used in the normalization process and can help identify extreme conditions in the market.
Min-Max Function: min_max(src)
The min-max function scales the input data between 0 and 100 by dividing the difference between the data point and the minimum value by the range between the maximum and minimum values. This standardizes the data, making it easier to compare across different indicators.
Slope Function: slope(source, length, n_len, pre_smoothing = 0.15, post_smoothing = 0.7)
The slope function calculates the slope of a given data source over a specified length, and then normalizes it using the provided normalization length. Pre-smoothing and post-smoothing values can be adjusted to control the level of smoothing applied to the data before and after calculating the slope.
Percent Function: percent(x, y)
The percent function calculates the percentage difference between two values, x and y. This is useful for comparing the relative change in different indicators.
In the given code, there are multiple indicators included. Here, we will discuss each of them in detail.
EMA Diff:
The Exponential Moving Average (EMA) Diff is the difference between two EMA values of different lengths. The EMA is a type of moving average that gives more weight to recent data points. The EMA Diff helps traders identify trends and potential trend reversals. In the code, the EMA Diff is calculated using the ema_diff() function, which takes length, close, filter, and len_norm as parameters.
Percent Rank EMA Diff:
The Percent Rank EMA Diff is the percentage rank of the EMA Diff within a given range. It helps traders identify overbought or oversold conditions in the market. In the code, the Percent Rank EMA Diff is calculated using the percent_rank_ema_diff() function, which takes length, close, filter, and len_norm as parameters.
EMA Diff Longer:
The EMA Diff Longer is the difference between two EMA values of different lengths, similar to EMA Diff but with a longer period. In the code, the EMA Diff Longer is calculated using the ema_diff_longer() function, which takes length, close, filter, and len_norm as parameters.
RSI Filter:
The Relative Strength Index (RSI) is a momentum oscillator that measures the speed and change of price movements. The RSI Filter is the RSI value passed through a filter to smooth out the data. In the code, the RSI Filter is calculated using the rsi_filter() function, which takes length, close, and filter as parameters.
RSI Diff Normalized:
The RSI Diff Normalized is the normalized value of the derivative of the RSI. It helps traders identify potential trend reversals in the market. In the code, the RSI Diff Normalized is calculated using the rsi_diff_normalized() function, which takes length, close, filter, len_mad, and len_norm as parameters.
Z Score:
The Z Score is a statistical measurement that describes a value's relationship to the mean of a group of values. In the context of the code, the Z Score is calculated for the closing price of a security. The z_score() function takes length, close, filter, and len_norm as parameters.
EMA Normalized:
The EMA Normalized is the normalized value of the EMA, which helps traders identify trends and potential trend reversals in the market. In the code, the EMA Normalized is calculated using the ema_normalized() function, which takes length, close, filter, and len_norm as parameters.
WMA Volume Normalized:
The Weighted Moving Average (WMA) Volume Normalized is the normalized value of the WMA of the volume. It helps traders identify volume trends and potential trend reversals in the market. In the code, the WMA Volume Normalized is calculated using the wma_volume_normalized() function, which takes length, volume, filter, and len_norm as parameters.
EMA Close Diff Normalized:
The EMA Close Diff Normalized is the normalized value of the derivative of the EMA of the closing price. It helps traders identify potential trend reversals in the market. In the code, the EMA Close Diff Normalized is calculated using the ema_close_diff_normalized() function, which takes length, close, filter, len_mad, and len_norm as parameters.
Momentum Normalized:
The Momentum Normalized is the normalized value of the momentum, which measures the rate of change of a security's price. It helps traders identify trends and potential trend reversals in the market. In the code, the Momentum Normalized is calculated using the momentum_normalized() function, which takes length, close, filter, and len_norm as parameters.
Slope Normalized:
The Slope Normalized is the normalized value of the slope, which measures the rate of change of a security's price over a specified period. It helps traders identify trends and potential trend reversals in the market. In the code, the Slope Normalized is calculated using the slope_normalized() function, which takes length, close, filter, and len_norm as parameters.
Trend Intensity:
Trend Intensity is a measure of the strength of a security's price trend. It is based on the difference between the average of price increases and the average of price decreases over a given period. The trend_intensity() function in the code calculates the Trend Intensity by taking length, close, filter, and len_norm as parameters.
Volatility Ratio:
The Volatility Ratio is a measure of the volatility of a security's price, calculated as the ratio of the True Range (TR) to the Exponential Moving Average (EMA) of the TR. The volatility_ratio() function in the code calculates the Volatility Ratio by taking length, high, low, close, and filter as parameters.
Commodity Channel Index (CCI):
The Commodity Channel Index (CCI) is a momentum-based oscillator used to help determine when an investment vehicle is reaching a condition of being overbought or oversold. The CCI is calculated as the difference between the mean price of a security and its moving average, divided by the mean absolute deviation (MAD) of the mean price. In the code, the CCI is calculated using the cci() function, which takes length, high, low, close, and filter as parameters.
These indicators are combined in the code to create a comprehensive trading strategy that considers multiple factors such as trend strength, momentum, volatility, and overbought/oversold conditions. The combined analysis provided by these indicators can help traders make informed decisions and improve their chances of success in the market.
The Radar Rider indicator is a powerful tool that combines multiple technical indicators into a single, easy-to-read visualization. By understanding the inner workings of each built-in indicator and their arrangement within the spider plot, traders can better interpret market conditions and make informed trading decisions.

Spider_PlotIntroduction:
Spider charts, also known as radar charts or web charts, are a powerful data visualization tool that can display multiple variables in a circular format. They are particularly useful when you want to compare different data sets or evaluate the performance of a single data set across multiple dimensions. In this blog post, we will dive into the world of spider charts, explore their benefits, and demonstrate how you can create your own spider chart using the Spider_Plot library.
Why Spider Charts are Cool:
Spider charts have a unique visual appeal that sets them apart from other chart types. They allow you to display complex data in a compact, easy-to-understand format, making them perfect for situations where you need to convey a lot of information in a limited space. Some of the key benefits of spider charts include:
Multi-dimensional analysis: Spider charts can display multiple variables at once, making them ideal for analyzing relationships between different data sets or examining a single data set across multiple dimensions.
Easy comparison: By displaying data in a circular format, spider charts make it simple to compare different data points, identify trends, and spot potential issues.
Versatility: Spider charts can be used for a wide range of applications, from business and finance to sports and health. They are particularly useful for situations where you need to analyze performance or make comparisons between different entities.
Creating Your Own Spider Chart with the Spider_Plot Library:
The Spider_Plot library is a user-friendly, easy-to-use tool that allows you to create stunning spider charts with minimal effort. To get started, you'll need to import the Spider_Plot library:
import peacefulLizard50262/Spider_Plot/1
With the library imported, you can now create your own spider chart. The first step is to normalize your data. Normalizing ensures that all data points fall within the 0 to 1 range, which is important for creating a visually balanced spider chart.
The Spider_Plot library provides the data_normalize function to help you normalize your data. This function accepts several parameters, including the normalization style ("All Time", "Range", or "Custom"), length of the range, outlier level, lookback period for standard deviation, and minimum and maximum values for the "Custom" normalization style.
Once you have normalized your data, you can create an array of your data points using the array.from function. This array will be used as input for the draw_spider_plot function, which is responsible for drawing the spider plot on your chart.
The draw_spider_plot function accepts an array of float values (the normalized data points), an array of background colors for each sector, a color for the axes, and a scaling factor.
Example Usage:
Here's an example script that demonstrates how to create a spider chart using the Spider_Plot library:
oc = data_normalize(ta.ema(math.abs(open - close), 20), "Range", 20)
// Create an array of your data points
data = array.from(tr, rsi, stoch, dev, tr, oc, tr)
// Define colors for each sector
colors = array.from(color.new(color.red, 90), color.new(color.blue, 90), color.new(color.green, 90), color.new(color.orange, 90), color.new(color.purple, 90), color.new(color.purple, 90), color.new(color.purple, 90))
// Draw the spider plot on your chart
draw_spider_plot(data, colors, color.gray, 100)
In this example, we have first normalized six different data points (rsi, source, stoch, dev, tr, and oc) using the data_normalize function. Next, we create an array of these normalized data points and define an array of colors for each sector of the spider chart. Finally, we call the draw_spider_plot function to draw the spider chart on our chart.
Conclusion:
Spider charts are a versatile and visually appealing tool for analyzing and comparing multi-dimensional data. With the Spider_Plot library, you can easily create your own spider charts and unlock valuable insights from your data. Just remember to normalize your data and create an array of data points before calling the draw_spider_plot function. Happy charting!
Library "Spider_Plot"
data_normalize(data, style, length, outlier_level, dev_lookback, min, max)
data_normalize(data, string style, int length, float outlier_level, simple int dev_lookback, float min, float max)
Parameters:
data (float) : float , A float value to normalize.
style (string) : string , The normalization style: "All Time", "Range", or "Custom".
length (int) : int , The length of the range for "Range" normalization style.
outlier_level (float) : float , The outlier level to exclude from calculations.
dev_lookback (simple int) : int , The lookback period for calculating the standard deviation.
min (float) : float , The minimum value for the "Custom" normalization style.
max (float) : float , The maximum value for the "Custom" normalization style.
Returns: array , The normalized float value.
draw_spider_plot(values, bg_colors, axes_color, scale)
draw_spider_plot(array values, array bg_colors, color axes_color, float scale)
Parameters:
values (float ) : array , An array of float values to plot in the spider plot.
bg_colors (color ) : array , An array of background colors for each sector in the spider plot.
axes_color (color) : color , The color of the axes in the spider plot. Default: color.gray
scale (float) : float , A scaling factor for the spider plot. Default: 10
Returns: void , Draws the spider plot on the chart.
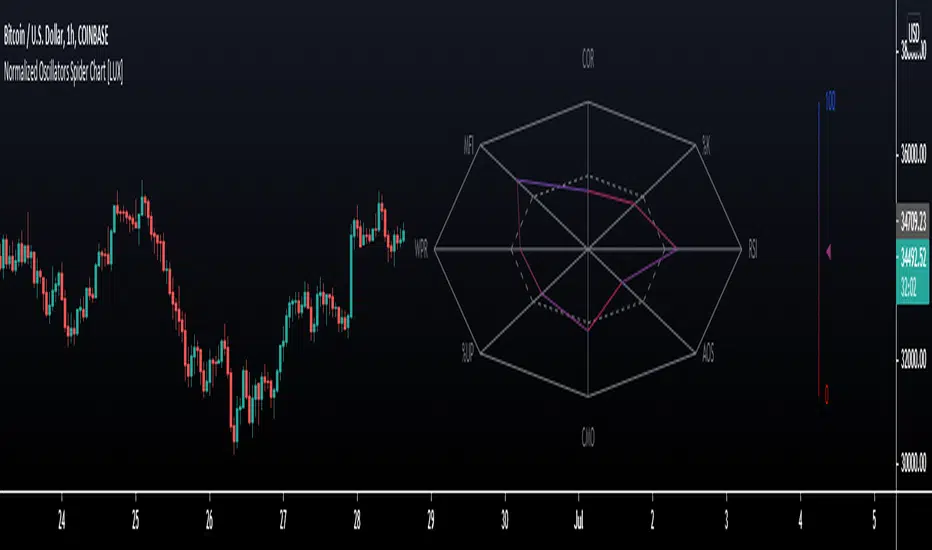
Normalized Oscillators Spider Chart [LuxAlgo]This indicator displays a spider chart overlaid on the user’s current chart allowing the visualization of information given by various normalized oscillators. It is possible to customize the spider chart by hiding certain oscillators from within the settings which removes their corresponding spokes from the chart.
Users can control the length settings of each oscillator individually or use a global length setting that applies to every oscillator. An additional meter element is displayed and aims to give the overall sentiment returned by the oscillators. This can also be used to gauge whether the market is trending or ranging.
This is a relatively simple application of a spider chart but can prove to be useful to some users.
1. Settings
RSI: Displays the Relative Strength Index spoke on the spider chart, includes the length setting on the right of the toggle.
%K: Displays the Stochastic Oscillator "%K" spoke on the spider chart, includes the length setting on the right of the toggle.
COR: Displays the Correlation Oscillator spoke on the spider chart, includes the length setting on the right of the toggle.
MFI: Displays the Money Flow Index oscillator spoke on the spider chart, includes the length setting on the right of the toggle.
WPR: Displays the Williams Percent Rank oscillator spoke on the spider chart, includes the length setting on the right of the toggle.
%UP: Displays the percentage of upward variations spoke on the spider chart, includes the length setting on the right of the toggle.
CMO: Displays the Chande Momentum Oscillator spoke on the spider chart, includes the length setting on the right of the toggle.
AOS: Displays the Aroon oscillator spoke on the spider chart, includes the length setting on the right of the toggle.
Global Oscillators Length: Determines whether all oscillators should use the same length settings, determined by the setting on the right of the toggle.
1.1 Style Settings
Spider Chart Length: Determines the horizontal width of the spider chart.
Spider Chart Offset: Offset between the most recent bar and the left extremity of the spider chart.
2. Usage
A spider chart can be a very useful visualization tool when it comes to seeing the individual characteristics of various variables at the same time.
Here, the tool can give a general sentiment on the direction of the trend without adding each indicator to your chart. It is also possible to determine when an oscillator is considered overbought or oversold with this indicator.
The dashed line represents the central value for each oscillator.
Disabling any of the oscillators from the settings will return a spider chart using fewer spokes.
The script also displays a meter that can be used to determine the overall sentiment given by all oscillators. This metric is based on the average value between each oscillator. An overall sentiment closer to 50 would indicate a ranging market.