Indicators, Strategies and Libraries
Library "HarmonicPattern" Functions to detect/check harmonic patterns from provided values. line_price_rate(point_c, point_b, point_a) Compute the price rate of the line AB divided by the the line BC Parameters: point_c : float, the price at point C. point_b : float, the price at point B. point_a : float, the price at point A. Returns: float ...
3ESRA v0.2a Coded by Vaida Bogdan 3ESRA consists of a 3 EMA cross + a close above (for longs) the quickest EMA or below (for shorts). Note that I've deactivated the RSI Cross Over/Under (you can modify the code and activate it). The strategy also uses a stop loss that's at 1 ATR distance from the entry price and a take profit that's...
This is a copy of the built-in All Candlestick Patterns indicator, but with an additional plot for each indicator to support exporting. When exporting, each candlestick pattern will have its own column, with a 1 indicating the candlestick pattern was detected, and 0 indicating it wasn't. The plots are all overlaid, so are they are not useful for viewing, they are...
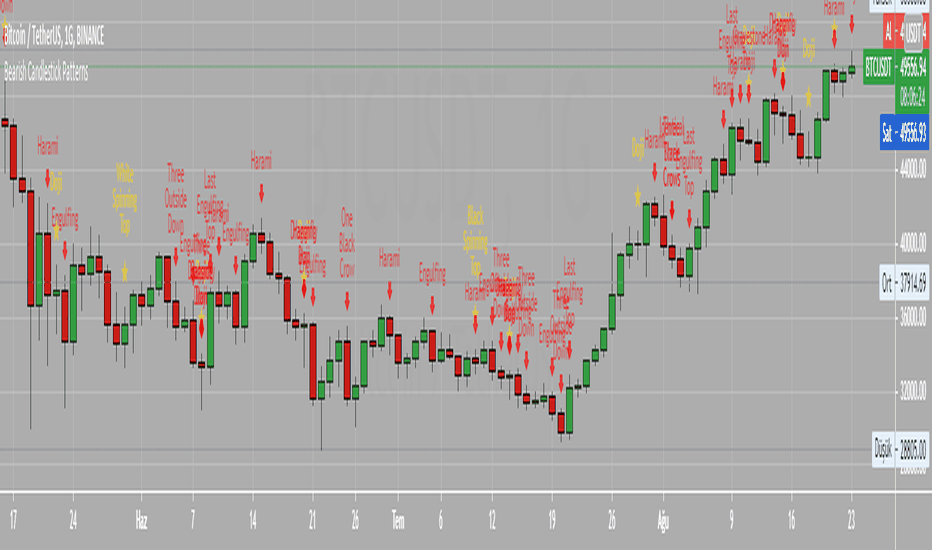
This script identifies common candlestick patterns and marks them with a tool-tip on the chart. It is a compilation of Tradingview's built-in candlestick finding scripts so it uses the same rules defined by Tradingview to identify the patterns. Instead of using a separate indicator for each candlestick pattern, you can use this script to find all the candlestick...
New risk management system: order entry, moving stop loss to breakeven + moving average filter (SMA)
This strategy is used as a benchmark to see how it compares with other strategies posted by me recently. In all, the below collection of candlestick patterns appears to be one of the best among the ones that can be found here, imho.
The script allows you to test popular candlestick patterns on various instruments and timeframes. In addition, you can configure risk management (if the value is zero, it means the function is disabled), and you can also specify the time of the trading session (for example, so that the positions are not transferred to the next day). The author is grateful to...
Introduction There are different and better way's to see price data, a candlestick chart is one of the best way to see the price since you have access to the open/high/low/close information, this is really efficient and can allow for naked non parametric trading strategies (candlesticks patterns) . But what about making candles out of indicators ? There are...
//Candle Patterns Ranked by Performance THOMAS N. BULKOWSKI //1. Bearish Three Line Strike +Up 67.38% //2. Bullish Three Line Strike -Down 65.23% //3. Bearish Three Black Crows -Down 59.83% //4. Bearish Evening Star -Down 55.85% //5. Bullish Upside Tasuki Gap +Up 54.44% //6. Bullish Inverted Hammer -Down 51.73% //7. Bullish Matching Low -Down 50.00% //8....
Doji Black Spinning Top White Spinning Top Bearish Abandoned Baby Bearish Advance Block Bearish Below The Stomach Bearish Belt Hold Bearish Breakaway Bearish Counter Attack Lines Bearish Dark Cloud Cover Bearish Deliberation Blok Bearish Descending Hawk Bearish Doji Star Bearish Downside Gap Three Methods Bearish Downside Tasuki Gap Bearish Dragonfly...
Bullish Abandone Baby Bullish Above The Stomach Bullish Belt Hold Bullish Breakaway Bullish Concealing Baby Swallow Bullish Counterattack Lines Bullish Deliberation Block Bullish Descent Block Bullish Doji Star Bullish Downside Gap Two Rabbits Bullish Dragonfly Doji Bullish Engulfing Bullish Hammer Bullish Harami Bullish Harami Cross Bullish High Price Gapping...
This is a script for a view I wanted to go along with the Autoview plugin I bought. Keep in mind this is my first script and was created for me to learn the Pinescript framework. This isn't meant to be perfect. Indicator colors are usually blue or green or red. Also keep in mind since this is my first script in a new framework, the more stuff I build the better...
This is a simple study designed to track multiple candlestick patterns. Custom alerts included.
Search indicators for "clouded" to find this one, and add to your chart. Takes lowest(min) and highest(max) of several bars, averages that over several bars, shifts by half of the middle of those two bar numbers, and colors the inbetween by candle color. You can choose 3 parameters. Please give feedback, or donation. Thanks.
orig. Ichimoku built-in, but rid of all lines but the 26-bars-displaced cloud


![Candlestick Patterns [DW] NZDUSD: Candlestick Patterns [DW]](https://s3.tradingview.com/z/ZkzKV1TV_mid.png)


