Indicators, Strategies and Libraries
TrustedSignals Dojji Scalper is our most basic trading algorithm. It is based on Candle Patterns that show potential market reversal points. The script has 3 different types of signals, which can be individually turned on and off: - Doji signals, based entirely on the Doji candle pattern and 2 Strong and Weak candle reversal patters As a bonus, we have included...
This is an advanced utility that uses fractal dimension and trend information to generate useful insights about price activity and potential trade signals. In this script, my Advanced FDI algorithm is used to estimate the fractal dimension of the dataset over a user defined period. Fractal dimension, unlike spatial or topological dimension, measures how...
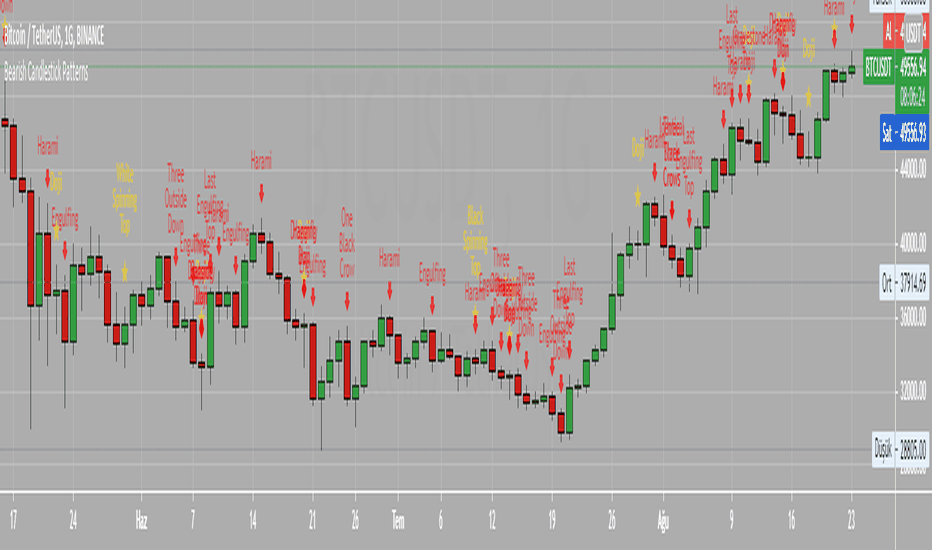
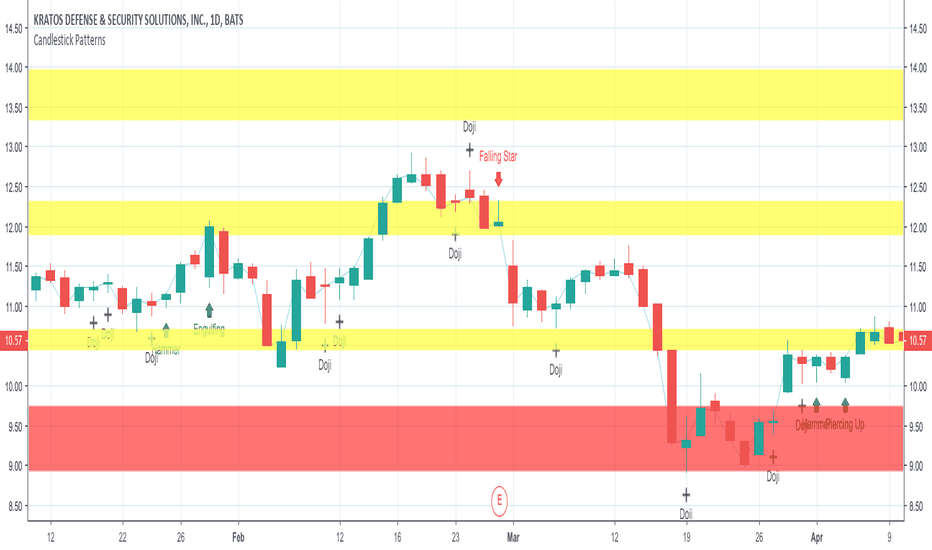
This script identifies common candlestick patterns and marks them with a tool-tip on the chart. It is a compilation of Tradingview's built-in candlestick finding scripts so it uses the same rules defined by Tradingview to identify the patterns. Instead of using a separate indicator for each candlestick pattern, you can use this script to find all the candlestick...
This script detects the following candlestick patterns: Bullish Patterns: - Normal 3 Bar Fractal - Enhanced 3 Bar Fractal - Engulfing - Harami ( Inside bar ) - Bullrami (Altenate Bull Harami) Bearish Patterns: - Normal 3 Bar Fractal - Enhanced 3 Bar Fractal - Engulfing - Harami ( Inside bar ) - Bearami (Alternate Bear Harami) - Shooting Star How it works: -...
Candlestick Patterns - Candlesticks are graphical representations of price movements for a given period of time. - There are candlestick patterns that try to predict the final direction, caused by pressure between buyers and sellers. As a general recommendation, use the candlestick patterns in the same direction of the current trend (continuations), for...
New risk management system: order entry, moving stop loss to breakeven + moving average filter (SMA)
This strategy is used as a benchmark to see how it compares with other strategies posted by me recently. In all, the below collection of candlestick patterns appears to be one of the best among the ones that can be found here, imho.
The script allows you to test popular candlestick patterns on various instruments and timeframes. In addition, you can configure risk management (if the value is zero, it means the function is disabled), and you can also specify the time of the trading session (for example, so that the positions are not transferred to the next day). The author is grateful to...
This indicator allows you to specify price zones in which to detect basic candlestick patterns. In the example above, I have specified the most immediate support and resistance zones on GBP/USD and set the script to detect engulfing candles. If a bearish engulfing candle occurs within the resistance zone a signal will be generated; likewise for bullish engulfing...
Introduction There are different and better way's to see price data, a candlestick chart is one of the best way to see the price since you have access to the open/high/low/close information, this is really efficient and can allow for naked non parametric trading strategies (candlesticks patterns) . But what about making candles out of indicators ? There are...
//Candle Patterns Ranked by Performance THOMAS N. BULKOWSKI //1. Bearish Three Line Strike +Up 67.38% //2. Bullish Three Line Strike -Down 65.23% //3. Bearish Three Black Crows -Down 59.83% //4. Bearish Evening Star -Down 55.85% //5. Bullish Upside Tasuki Gap +Up 54.44% //6. Bullish Inverted Hammer -Down 51.73% //7. Bullish Matching Low -Down 50.00% //8....
Doji Black Spinning Top White Spinning Top Bearish Abandoned Baby Bearish Advance Block Bearish Below The Stomach Bearish Belt Hold Bearish Breakaway Bearish Counter Attack Lines Bearish Dark Cloud Cover Bearish Deliberation Blok Bearish Descending Hawk Bearish Doji Star Bearish Downside Gap Three Methods Bearish Downside Tasuki Gap Bearish Dragonfly...
Bullish Abandone Baby Bullish Above The Stomach Bullish Belt Hold Bullish Breakaway Bullish Concealing Baby Swallow Bullish Counterattack Lines Bullish Deliberation Block Bullish Descent Block Bullish Doji Star Bullish Downside Gap Two Rabbits Bullish Dragonfly Doji Bullish Engulfing Bullish Hammer Bullish Harami Bullish Harami Cross Bullish High Price Gapping...
The indicator discovers profitable patterns by associating Price Season of multiple time frames. Full Name: 9 Seasons Rainbow - Multiple Time Frames Associated Price Wave Pattern Indicator This is redefined from “9 Seasons Rainbow Indicator PRO”, with clearer definition of 9 Seasons and user manual. Version: Invite-Only PRO Language: English Copyright:...
Паттерн "Доджи" - показывает равновесие сил продавцов и покупателей. Хотя сам по себе этот паттерн не является сигналом к открытию сделки, не стоит его всегда игнорировать. Доджи встречается в более сложных паттернах, состоящих из двух - трех свечей, например: "Утренняя звезда", "Вечерняя звезда" и "Крест харами" (подробнее о них я расскажу в своих следующих...
Candlestick patterns identified with win percentage.
![[TrustedSignals] Doji Scalper EURUSD: [TrustedSignals] Doji Scalper](https://s3.tradingview.com/6/6eDf1Joz_mid.png)

![Fractal Trend Trading System [DW] BTCUSD: Fractal Trend Trading System [DW]](https://s3.tradingview.com/b/bl6R7SDU_mid.png)


![9 Seasons Rainbow Multiple Time Frames Pattern PRO [9SPEN] BTCUSD: 9 Seasons Rainbow Multiple Time Frames Pattern PRO [9SPEN]](https://s3.tradingview.com/u/ukE1LLOl_mid.png)


