Indicators, Strategies and Libraries
Introduction There are different and better way's to see price data, a candlestick chart is one of the best way to see the price since you have access to the open/high/low/close information, this is really efficient and can allow for naked non parametric trading strategies (candlesticks patterns) . But what about making candles out of indicators ? There are...
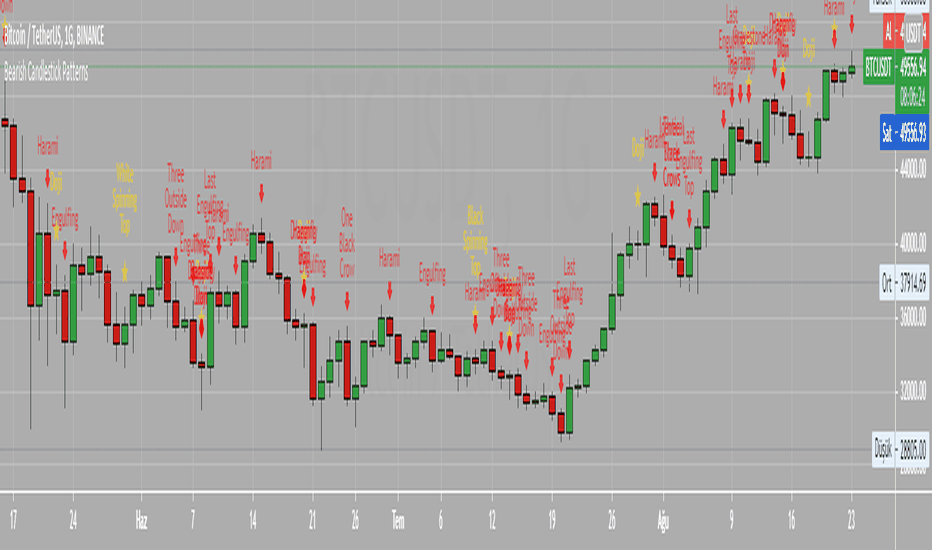
//Candle Patterns Ranked by Performance THOMAS N. BULKOWSKI //1. Bearish Three Line Strike +Up 67.38% //2. Bullish Three Line Strike -Down 65.23% //3. Bearish Three Black Crows -Down 59.83% //4. Bearish Evening Star -Down 55.85% //5. Bullish Upside Tasuki Gap +Up 54.44% //6. Bullish Inverted Hammer -Down 51.73% //7. Bullish Matching Low -Down 50.00% //8....
Doji Black Spinning Top White Spinning Top Bearish Abandoned Baby Bearish Advance Block Bearish Below The Stomach Bearish Belt Hold Bearish Breakaway Bearish Counter Attack Lines Bearish Dark Cloud Cover Bearish Deliberation Blok Bearish Descending Hawk Bearish Doji Star Bearish Downside Gap Three Methods Bearish Downside Tasuki Gap Bearish Dragonfly...
Bullish Abandone Baby Bullish Above The Stomach Bullish Belt Hold Bullish Breakaway Bullish Concealing Baby Swallow Bullish Counterattack Lines Bullish Deliberation Block Bullish Descent Block Bullish Doji Star Bullish Downside Gap Two Rabbits Bullish Dragonfly Doji Bullish Engulfing Bullish Hammer Bullish Harami Bullish Harami Cross Bullish High Price Gapping...
The indicator discovers profitable patterns by associating Price Season of multiple time frames. Full Name: 9 Seasons Rainbow - Multiple Time Frames Associated Price Wave Pattern Indicator This is redefined from “9 Seasons Rainbow Indicator PRO”, with clearer definition of 9 Seasons and user manual. Version: Invite-Only PRO Language: English Copyright:...
Паттерн "Доджи" - показывает равновесие сил продавцов и покупателей. Хотя сам по себе этот паттерн не является сигналом к открытию сделки, не стоит его всегда игнорировать. Доджи встречается в более сложных паттернах, состоящих из двух - трех свечей, например: "Утренняя звезда", "Вечерняя звезда" и "Крест харами" (подробнее о них я расскажу в своих следующих...
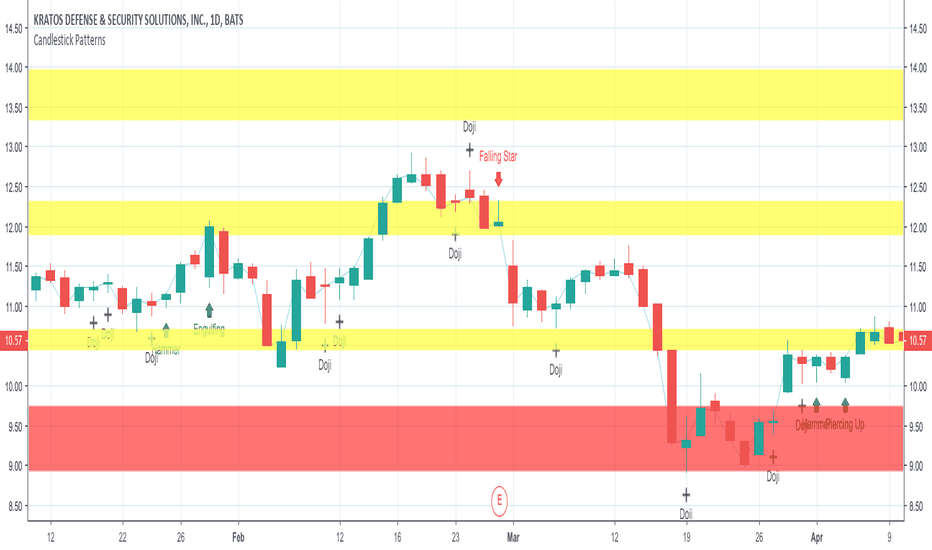
Candlestick patterns identified with win percentage.
This is a script for a view I wanted to go along with the Autoview plugin I bought. Keep in mind this is my first script and was created for me to learn the Pinescript framework. This isn't meant to be perfect. Indicator colors are usually blue or green or red. Also keep in mind since this is my first script in a new framework, the more stuff I build the better...
This is a simple study designed to track multiple candlestick patterns. Custom alerts included.
Search indicators for "clouded" to find this one, and add to your chart. Takes lowest(min) and highest(max) of several bars, averages that over several bars, shifts by half of the middle of those two bar numbers, and colors the inbetween by candle color. You can choose 3 parameters. Please give feedback, or donation. Thanks.
orig. Ichimoku built-in, but rid of all lines but the 26-bars-displaced cloud


![9 Seasons Rainbow Multiple Time Frames Pattern PRO [9SPEN] BTCUSD: 9 Seasons Rainbow Multiple Time Frames Pattern PRO [9SPEN]](https://s3.tradingview.com/u/ukE1LLOl_mid.png)


![Candlestick Patterns [DW] NZDUSD: Candlestick Patterns [DW]](https://s3.tradingview.com/z/ZkzKV1TV_mid.png)


