Quick and easy guide to TradingView screeners
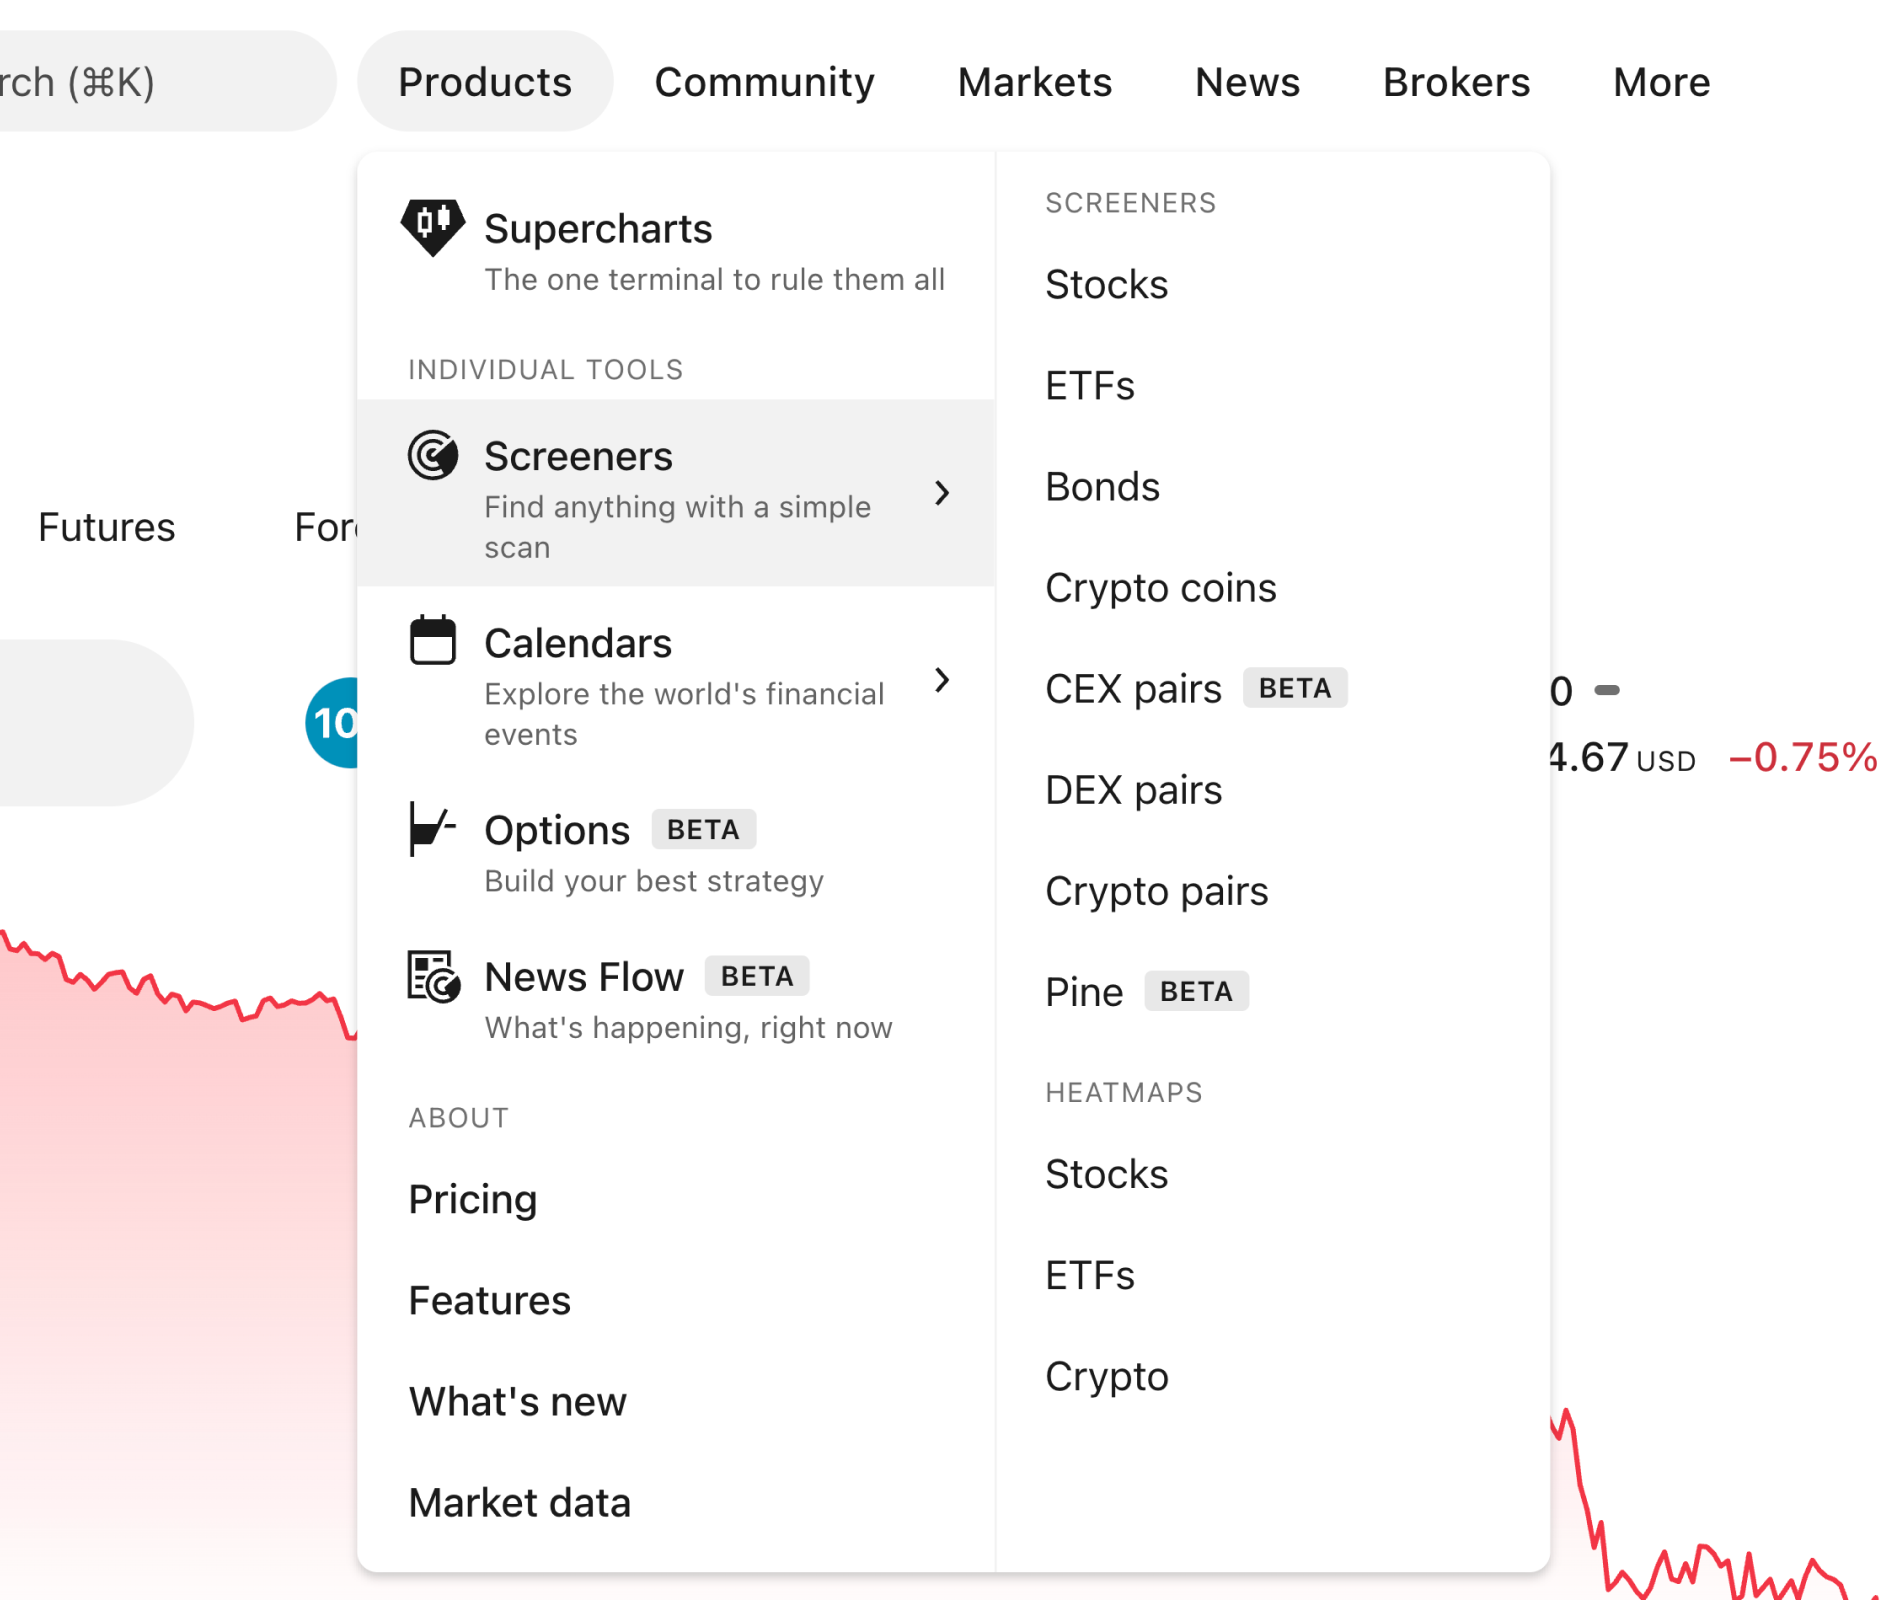
A screener is a universal tool that allows you to browse markets and find opportunities in a vast sea of assets. To start working with TradingView screeners, simply open the Screener section in the main menu and select the necessary tool.
There are several blocks available in each screener.
- Name of the screener/screen. When clicked on, it opens the screener’s menu.
- The top filter panel, located above the table.
- Table and its elements: columns, column sets, and a sorting menu.
- Gear button, opening screener settings.

Screener menu
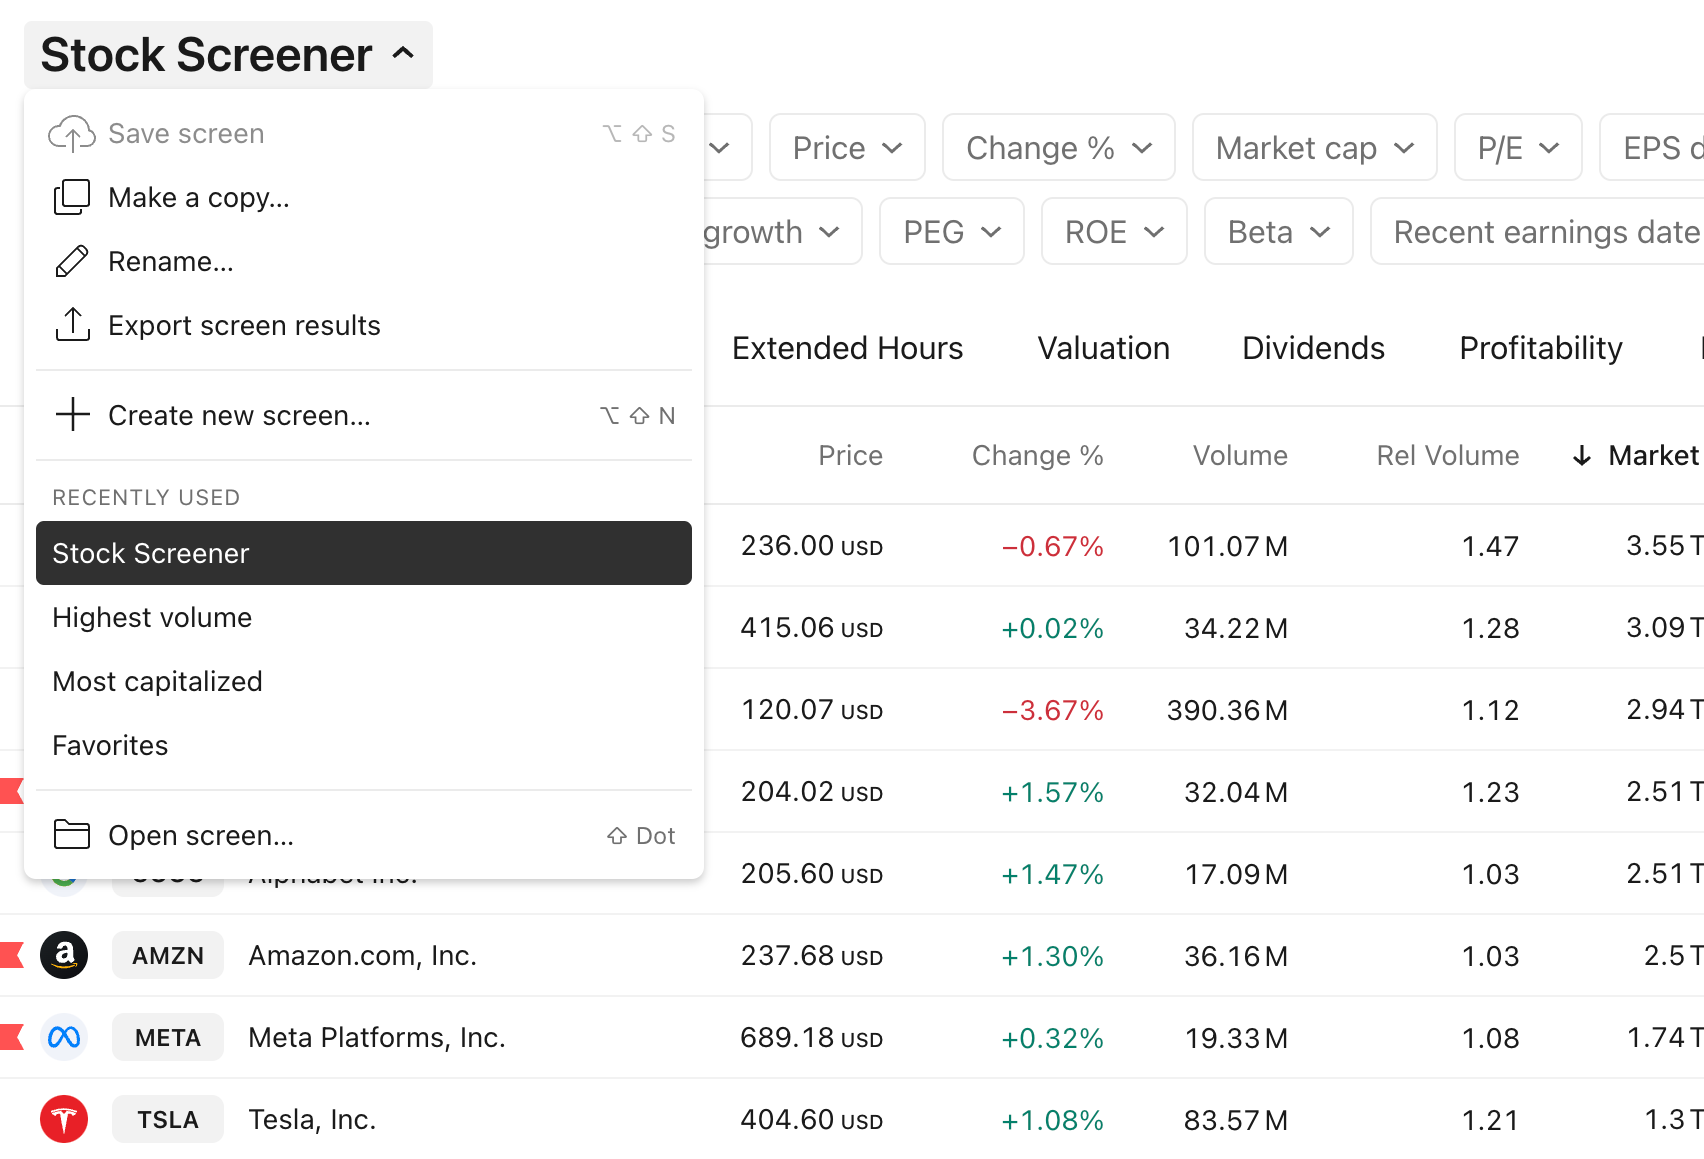
Clicking on a screener/template’s name opens a drop-down menu where you will find several helpful features. The list depends on the screener, let’s take a look at what the Stock Screener has.
- Save screen. Allows you to save and work with your own templates.
- Make a copy. Makes a copy of your screen.
- Rename. Allows you to change the name of your screen.
- Export screen results. Exports your screen’s data and saves it in a CSV file.
- Create new screen. Opens a fresh screen for you to start over with your analysis.
- My screens section. Lists all the previously saved screens of yours.
- Open screen. Lets you open either one of your saved screens or one curated by our team that allows you to track specific groups of assets.
Filter panel
The filter panel is located above the table.
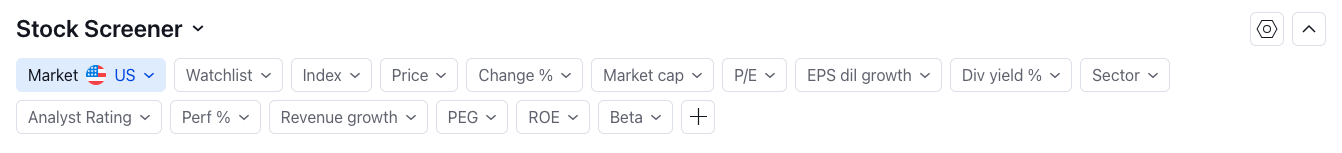
It’s easy to customize the panel to fit your analysis. Here’s what you can do.
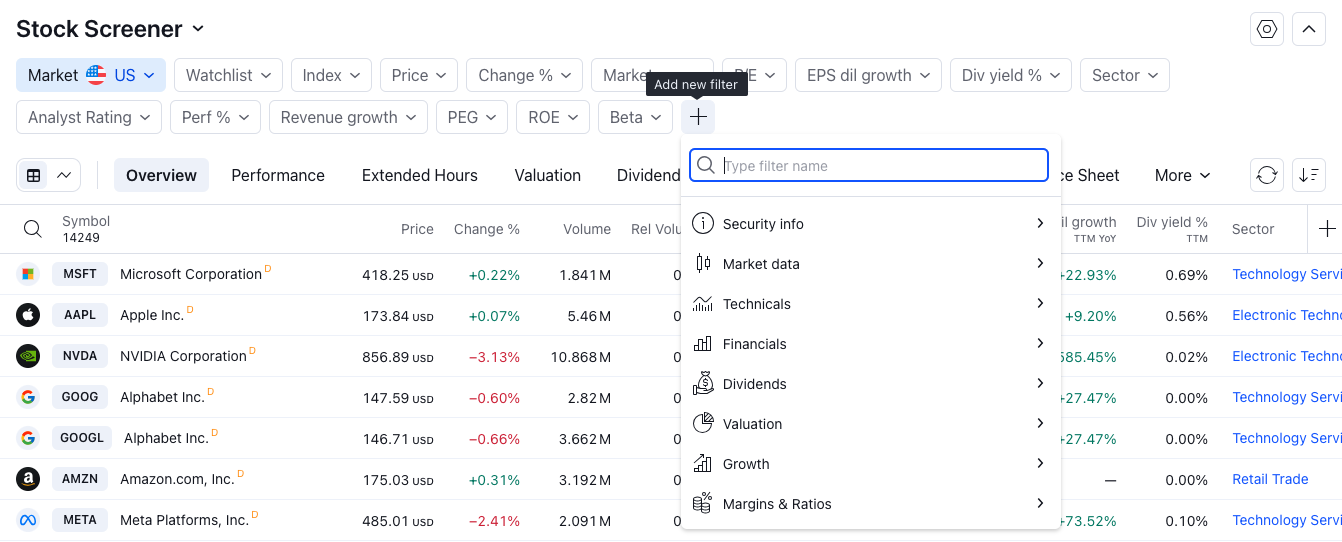
- Create and add filters to the panel
- Remove filters

- Set filter values: choose one of the default values or create a custom filter by clicking Manual setup.
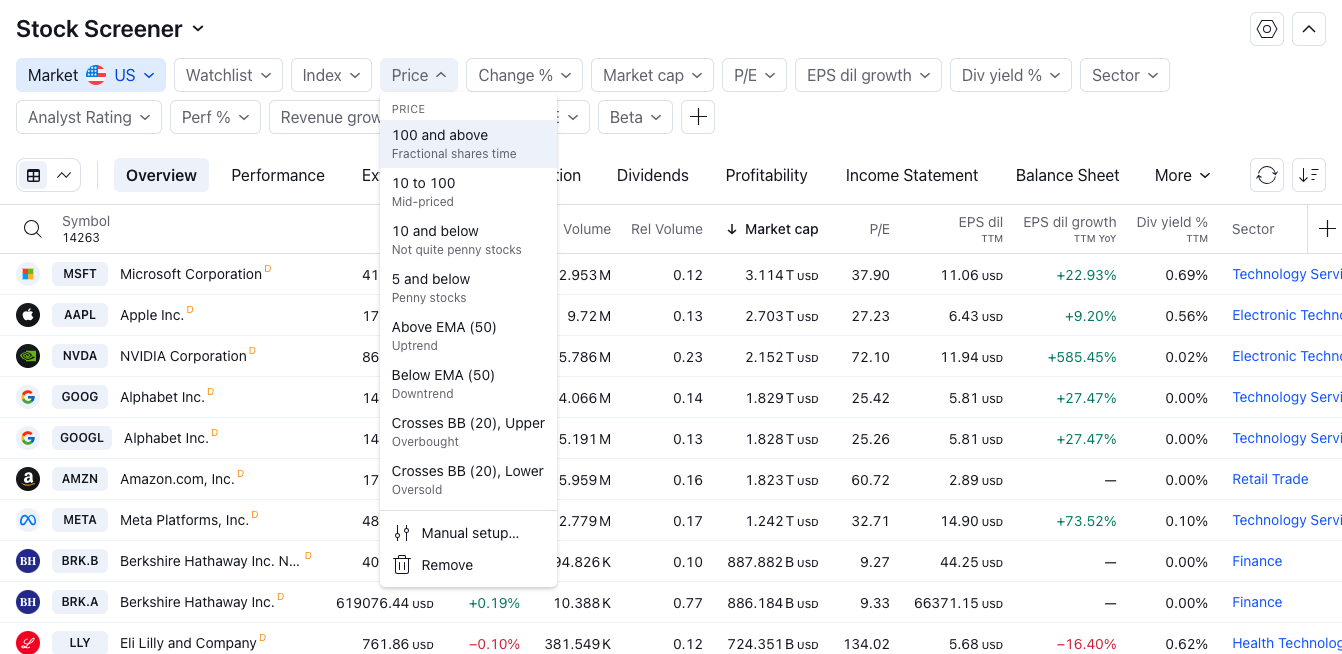
- Hide the panel by clicking on the arrow in the upper right corner.
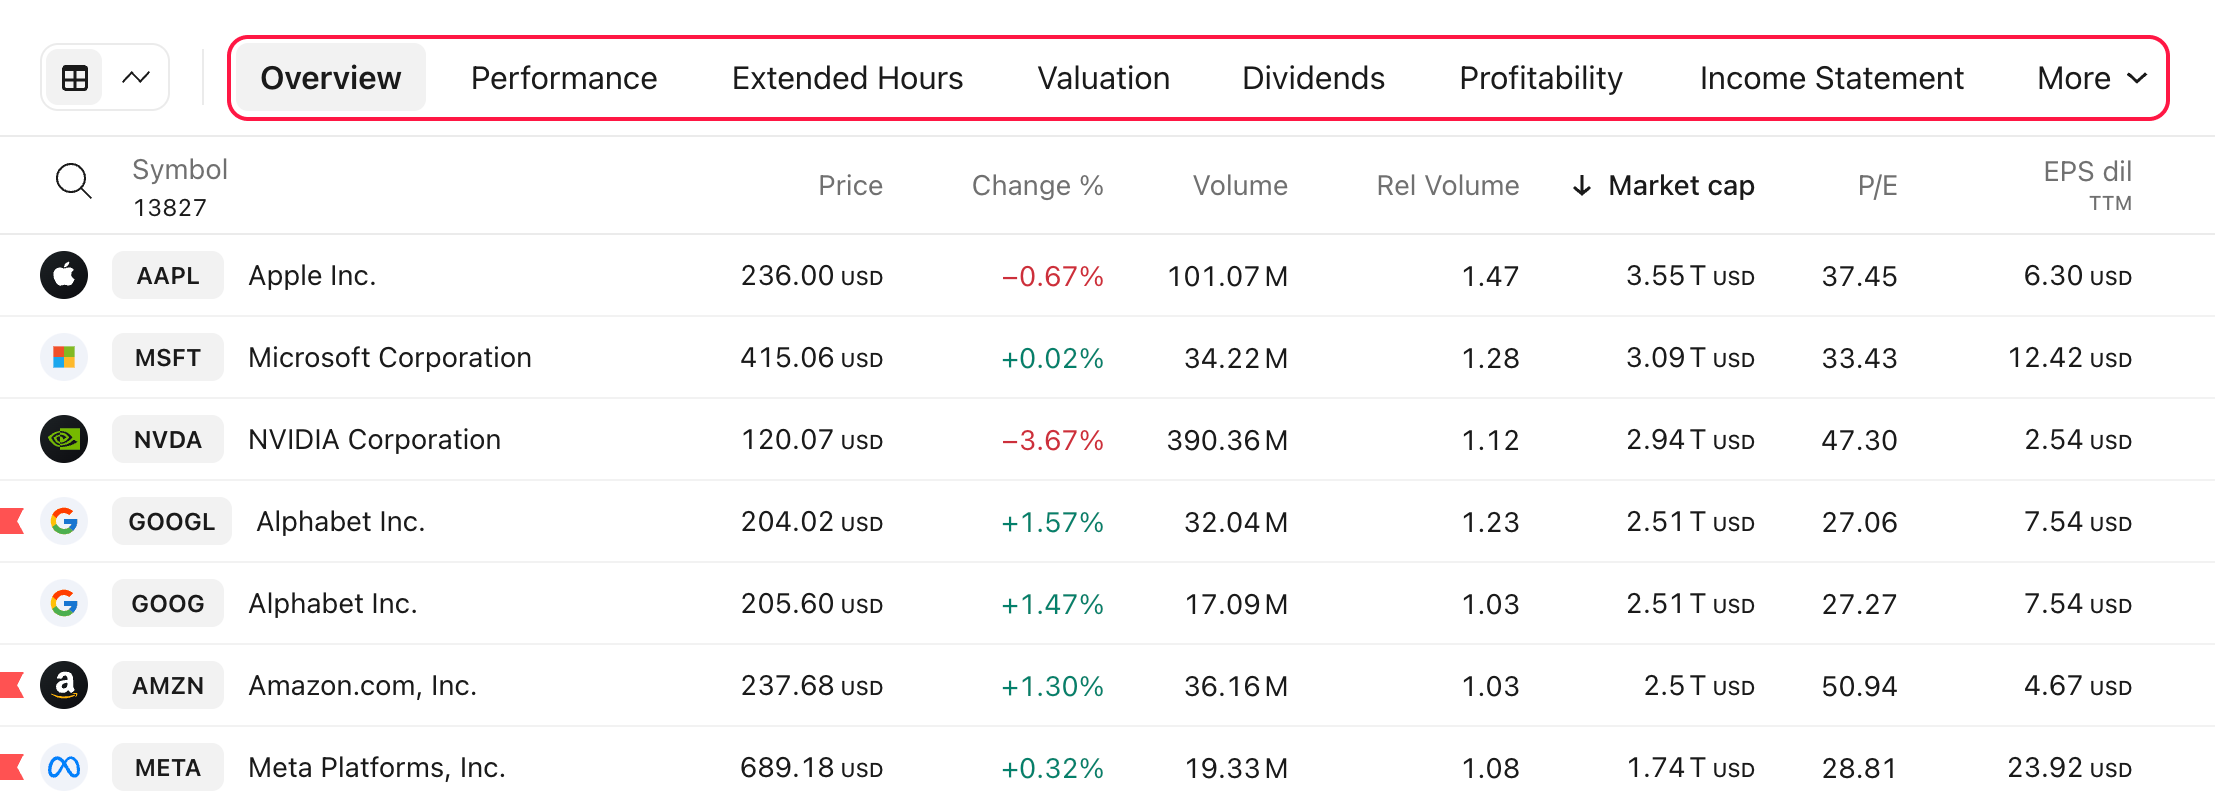
Table
Below the filter panel, there is a table where assets are gathered and their stats are displayed. Just like the filter panel, this table is customizable, allowing you to see only the data you're searching for.

For starters, you can select a ready-made set of columns to explore assets from a certain viewpoint (Performance, Risk, Coupon, etc.). Once you’ve selected a column set or decided to create your own, you can start working with columns.
Add columns by clicking the plus sign, sort the table by clicking on a desired column, or open the context menu with a right-click where you can:
- Customize the column
- Select the sorting type
- Change a column’s position in the table by moving it left and right
- Remove a column

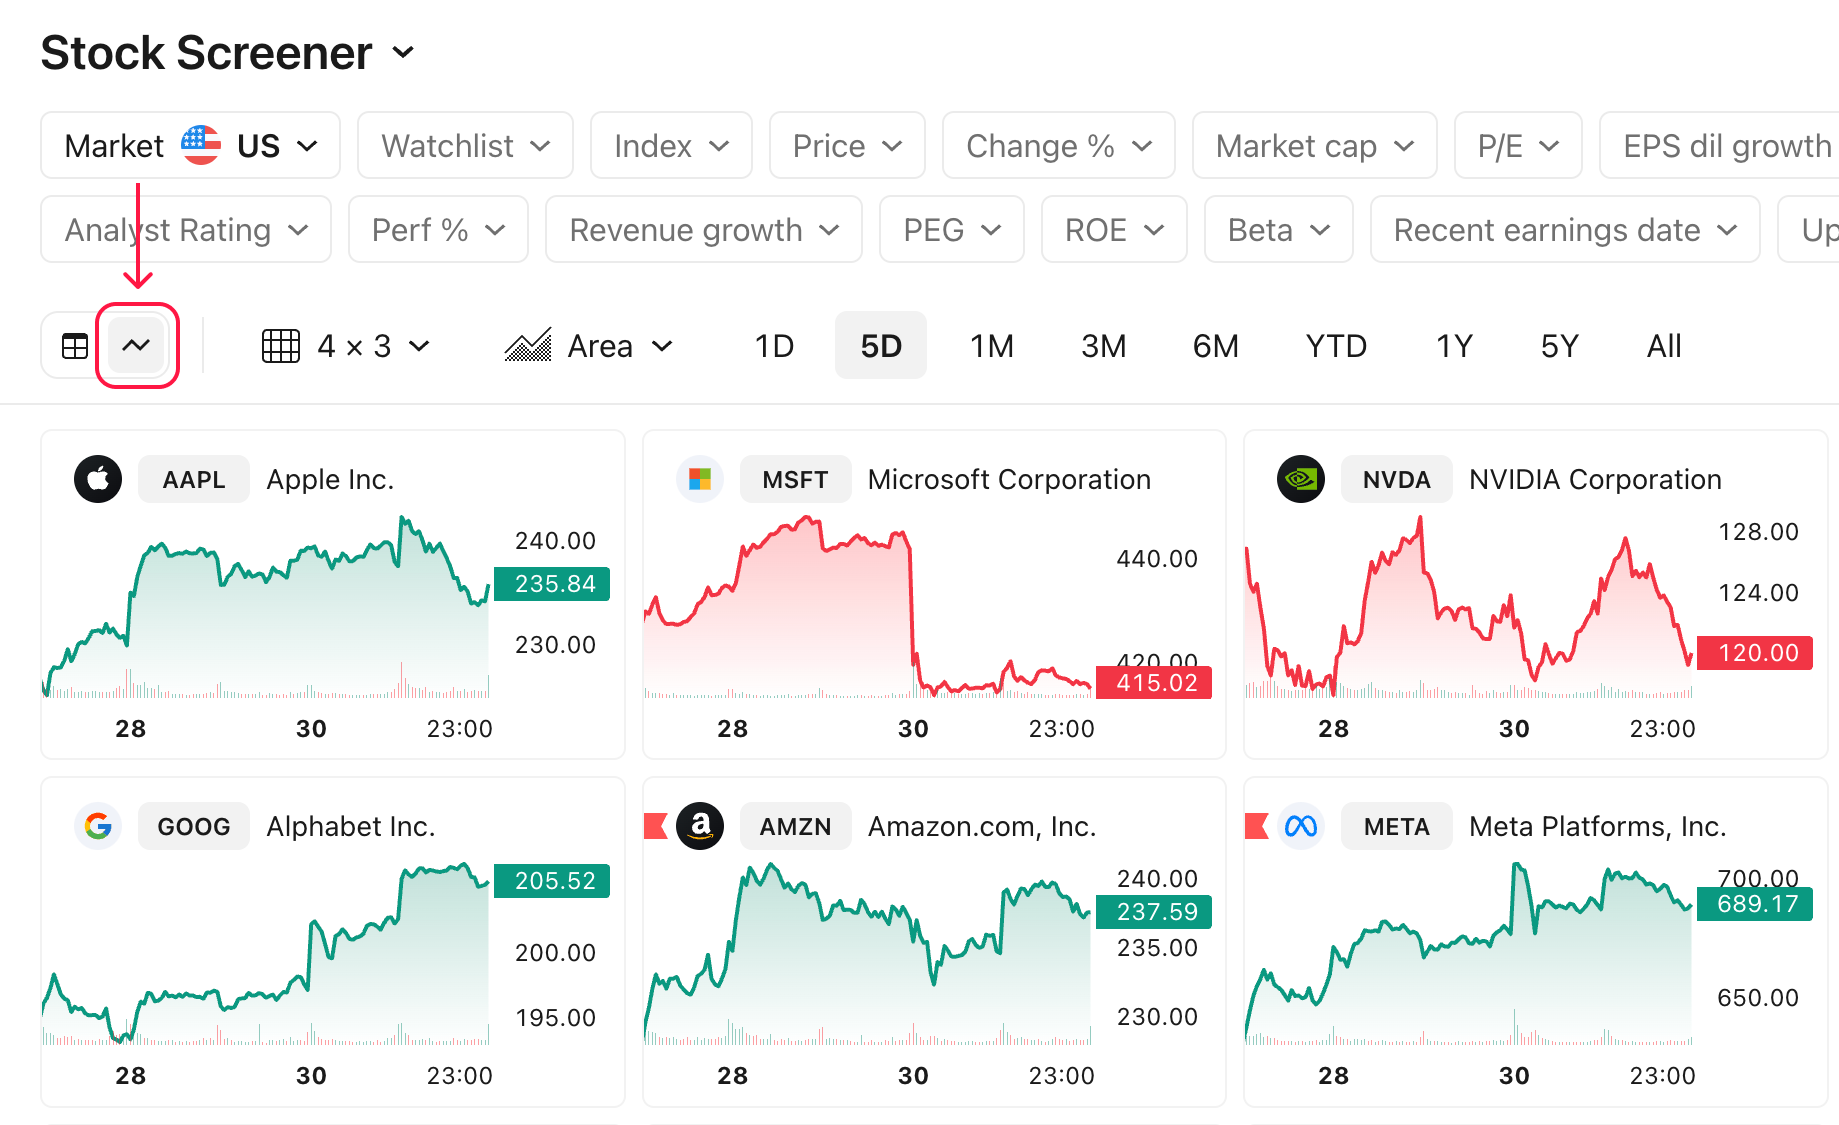
The table’s upper left corner also has one important feature — Chart view. This displays the table as a grid of charts instead of rows. It helps visualize data and comes with additional settings allowing you to select a chart type, set the interval, and customize the grid.
Screener settings
There are several features in the screener settings that will help you manage the scanned results. Some of them are specific to certain screener types, so let’s take a look at the ones of the Stock screener:
- Table view settings: here you can toggle symbol description, symbol type, and currency
- Chart view settings: select whether to display the symbol description.
- Auto refresh: choose how often the data in the table gets updated, every 10 seconds, every 1 minute, or never.
- Financials currency: helps you to select in which currency the data is displayed.

These are the basics of each screener. If you need more details, please read the articles below: