1INCH in Accumulation!This is a great one, that hasn't moved against $BTC.. YET.
I'm not concerned about the moves CRYPTOCAP:1INCH has made against the dollar.
They will look miniscule when CRYPTOCAP:1INCH starts outperforming BTC!
I'm not going to miss out on this one!
1INCHBTC trade ideas

1inch Recovers Above Support (300% Bullish Wave Mapped; Easy)1inch breaks below its June 2023 low just to recover, to move back above it, to fall below; back and forth.
This is the accumulation phase.
If you notice in August, September, October 2023, as an example, 1INCHBTC did move back above its June 2023 low but still traded below EMA100 and MA200... And it continued to fluctuate within a tight range for months.
Present time 1INCHBTC produced a higher low compared to October and December 2023 and is moving back above its June 2023 low support.
What is different this time?
Won't it fall back down?
The difference is the moving averages are now all behind; price action is moving above resistance in the form of moving averages.
After a higher low, with high volume, 1INCHBTC is now moving above EMA100/50 and MA200.
This indicates that the doors are open for long-term growth.
The targets can be seen on the chart.
Namaste.

✳️ Trading vs AI (Robots) & How To Beat Them!It is pretty clear how things will turn out here because of what is happening after the shakeout 3-January.
1INCHBTC trades above EMA100 and EMA50 as well as its June 2023 low, this even though we have a major move just two days ago.
The interesting part of the wild move is how the wicks show up to both sides, up and down. This means that the market manipulators where not just trying to remove either longs or shorts, they were removing both sides; all over-leveraged positions got liquidated on these days.
So 1INCHBTC remained above MA200 and has a full green candle today, this translates into a strong bullish signal.
Patience is key
Now, based on these signals 1INCHBTC is set to go bullish but it can start growing literally today, within a few days just as it can be weeks or months, it is impossible to tell.
The bots (algorithms) that are used by exchanges adapt live. Say for example many people find this pair and decide to buy. The pair was set to grow based on computer programs but since many people bought it gets delayed. If there are not many people holding the pair it will move strong up, right away. So many people buy and the waiting time gets changed from one week to two months, most of the people become impatient at exactly 1.9 months and once they decide to sell because they waited too long then prices start to grow.
The only way this system can be beaten is by waiting long-term. Another important point is the market cycle... At a certain time it doesn't matter how many people buy or how each one of us individually behave, the time to move comes and everything moves but this only happens in the "meat" of a bullish phase, same in reverse for a bearish wave.
The "wild move" happened because there were too many players with too high leverage, so the bots adapt and start buying and selling in a matter to liquidate them all... After the excesses are removed, it is time to grow.
➖ Planning is always necessary, if profits is the goal.
➖ Patience is mandatory, if you want to beat the bots.
Namaste.

1inch token formed bullish Cypher for upto 10.50% pumpHi dear friends, hope you are well and welcome to the new trade setup of 1inch token with BTC pair.
Previously we caught almost 35% pump of 1INCH as below:
Now on a 4-hr time frame, 1inch has almost completed a bullish Cypher move for another price reversal.
Note: Above idea is for educational purpose only. It is advised to diversify and strictly follow the stop loss, and don't get stuck with trade.

#1INCH/BTC - Long - Potential 6.64%Direction: Long
Market: Spot
Risk: 0.25% - 1%
#BTC_1INCH
Exchange: BINANCE
Timeframe: 360
TP1: 0.00001992
Entry: 0.00001866
STOP: 0.0000174
Entry Conditions:
| Trendbreak
| RSI momentum

✳️ 1inch Double Signal | Recovery & BTC Correction Confirmation1INCHBTC Starts to recover after a long-term lower low.
This is a double signal.
- The first part of the signal works for 1NCHBTC, it is going up after the lower low, no volume on this new 10 months low.
- The second part is Bitcoin, this confirms that Bitcoin will enter a correction/retrace, this is something that we have been expecting and should be no surprise.
The Altcoins vs Bitcoin pairs will grow while Bitcoin takes a break.
This is healthy, I will show you a few more pairs that works as confirmation of these two signals, the ALTSBTC recovery and the Bitcoin correction.
Namaste.

#1INCHBTC - Long - Potential 16.57%Style: SWING
Direction: LONG
Market: SPOT
Risk: 0.25% - 1%
EXCHANGE: BINANCE
#BTC_1INCH
TIMEFRAME: 720
ENTRY: 0.00001984
⎿ TP2: 0.00002312
⎿ TP1: 0.00002148
STOP: 0.0000182
Longterm trend break with volume.

$1INCH/#BTC [#1inch Network]: Resistance_Breakout_Confirmation◳◱ We've detected a Resistance Breakout and Confirmation on the $1INCH / $BTC chart. The price has broken above a key resistance level and has been confirmed by a strong candle, indicating a potential bullish trend. The next resistance key levels are at 0.00002487 | 0.00002605 | 0.00002843 and the major support zones are respectively at 0.00002249 | 0.00002129 | 0.00001891. We may consider entering a trade at the current price zone at 0.00002431 and targetting higher levels.
◰◲ Technical Metrics :
▣ Mrkt Price: 0.00002431 ₿
▣ 24HVol: 19.889 ₿
▣ 24hChng: 1.081%
◲◰ Pivot Points - Levels :
◥ Resistance: 0.00002487 | 0.00002605 | 0.00002843
◢ Support: 0.00002249 | 0.00002129 | 0.00001891
◱◳ Indicators recommendation :
▣ Oscillators: BUY
▣ Moving Averages: STRONG_BUY
◰◲ Technical Indicators Summary : STRONG_BUY
◳◰ Market Sentiment Index :
▣ News sentiment score is N/A
▣ Twitter sentiment score is 0.57 - Bullish
▣ Reddit sentiment score is 0.87 - Very Bullish
▣ In-depth 1INCHBTC technical analysis on Tradingview TA page
▣ What do you think of this analysis? Share your insights and let's discuss in the comments below. Your like, follow and support would be greatly appreciated!
◲ Disclaimer
Please note that the information and publications provided are for informational purposes only and should not be construed as financial, investment, trading, or any other type of advice or recommendation. We encourage you to conduct your own research and consult with a qualified professional before making any financial decisions. The use of the information provided is solely at your own risk.
▣ Welcome to the home of charting big: TradingView
Benefit from a ton of financial analysis features, instruments and data. Have a look around, and if you do choose to go with an upgraded plan, you'll get up to $30.
Discover it here - affiliate link -

$1INCHcan't go wrong with a successful flip of the 200
in process of testing it right now
looking to hop in with invalidation below white line

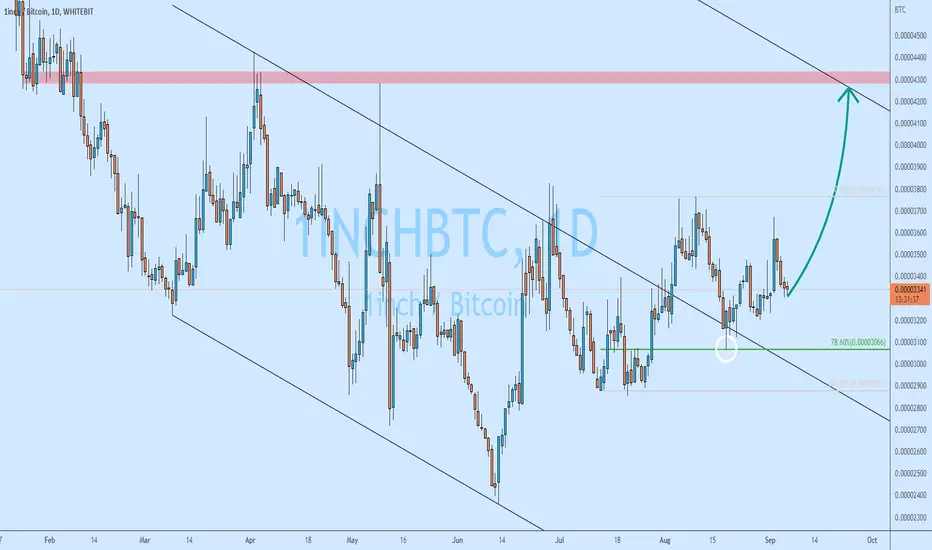
1Inch seems strong!Here is the possible pathway for the 1INCHBTC which seems relatively strong…expect the pair to bounce to the depicted zone…lets see how its gonna play out
Always a student

1inch token forming a bullish Gartley | A good buy opportunityHi dear friends, hope you are well and welcome to the new trade setup of 1inch token with Bitcoin pair.
Our last successful trade of 1INCH was below:
On a monthly time frame a big move of 1inch is still in play as below:
Now on a 4-hr time frame, 1INCH is about to complete a bullish Gartley pattern.
Note: Above idea is for educational purpose only. It is advised to diversify and strictly follow the stop loss, and don't get stuck with trade

1inch long term1inch chart look bulls i think is idea power of three.
1 2 month and will see real power of 1inch accumulation.

1INCH/BTC is about to explode1INCH broke above the descending channel. After the breakout, on a pullback, we can witness a clean bounce off the Fibonacci support. This leads me to the conclusion, that bulls are getting very active. Overall, fast growth is expected to the nearest supply area.
1INCH formed bullish Gartley | A good buy opportunityHi dear friends, hope you are well and welcome to the new trade setup of 1inch token with Bitcoin pair.
Previously I shared a long-term trade-setup for 1inch which is still in play as below:
Now on a 4-hour time frame, 1INCH has completed a bullish Gartley pattern. Right now, after completing the final leg it is slightly moved up, therefore, we can wait for some price correction.
Note: Above idea is for educational purpose only. It is advised to diversify and strictly follow the stop loss, and don't get stuck with trade

1INCH/BTC bottom is in1INCH/BTC bottom is in
Bullish divergence on the 1 day.
Broken through historical price support and the brought back up above support for confirmation.

1INCH / Bitcoin holding wellDespite bitcoin price sliding, 1INCH/USDT has almost found a point where the price isn't sliding with it anymore.
This is helped by the fact that the 1INCH/BTC pair has been performing very well. It recently bounce of historical support. It is now approaching resistance overhead, and the RSI has come in a bit, so I question as to if it will continue to do so well. But if the price can continue to hold whilst bitcoin slides, and if we could get some consolidation here around resistance. It would be very promising (especially when bitcoin finally bounces).

1INCH / BTC descending wedgeThis descending wedge looks pretty sweet. Looking for some strength on the bitcoin pairing to help the USDT pairing.

Looks cleaner when plotted on the daily.Looks cleaner when plotted on the daily. Love a BTC pair
Although that said, I will also post what Inverse head and shoulders pattern we are looking at here....

Inverser head and shoulders 1INCH/BTCWhich option should i go for. Should inverse head and shoulders strictly be horizontal lines.
I am in favour of the option 2 though as it looks the cleanest, maybe the price will bounce around between the three.

1INCH/BTC testing resistance as support1INCH/BTC testing resistance as support
Seems to be testing that resistance as support pretty hard, if we can break away from this point, the sky will be the limit.
Almost looks like there is an inverse head and shoulders forming here on the 1 hour chart.

if bitcoin tanks. this might save my longIf bitcoin decides to take a step down, the 1INCH/BTC chart might just save my long in USDT. It started a capitulation off macro support and RSI bullish divergence on higher time frames. This has pulled back but is looking lie it may continue.
What if Bitcoin tanks and this one doesnt, and this one goes up. Could attract a lot of attention.

Bullish divergence 1 day chartbullish divergence 1 day chart 1Inch/BTC
Its a weak bullish divergence but hopefully patience will come through. The money flowing into bitcoin right now will hopefully flow through to the alts.

1 INCH investment planHere is my investment plan on 1INCH/BTC pair. I put money on this pair if it breaks the downtrends and shows bullish signals bot on RSI and MACD
