Aave —Full Correction Is Good (Low Prices)A "bear market" cannot develop after a full correction. It doesn't make sense...
AAVEUSDT peaked 16-December 2024 and it has been red. And some people are saying, "It is going to go down. The start of a bear market." It already went down. The bullish action here started in October 2024 and has been corrected by more than 100%.
The action before and lower prices were all part of a long-term consolidation phase.
It took forever. Aave bottomed in June 2022 and consolidated for so long. Then, last year, it produced a strong advance. This is not the end, this is the start.
This advance ends in a higher low as the chart shows today, from this higher low we will get a continuation and establishment of a bullish trend.
For a bull-trend all we need is higher highs and higher lows. It is inconceivable to think that AAVEUSDT will break below its June 2022 low. Impossible. It will be going up.
So we have the first high and now the higher low, when the next advance happens, you have your higher high and that's it, that's how a bull market works.
The next high will produce the same results. A correction and this correction will end higher compared to the current low. This higher low will produce one final advance and this advance will be marketwide, the 2025 bull market bull run, projected to happen in late 2025.
Now, you cannot buy when prices are high, only when prices are low.
Right now, AAVEUSDT is trading at the lowest prices possible. It is trading within the same consolidation range that was active since mid-2022. This is as low as it can go.
This is a great opportunity. No bear market, we are in a bull market year and we are only weeks away before the start of the 2025 bull market cycle, the best and biggest bullish phase since 2021. It will be awesome.
The chart reveals everything you need to know.
The bottom, but also the top.
Namaste.
AAVEUSDT trade ideas

Aave long to $180Market been pushing more aggressive. Things have change. I got caught up in a few shorts but lets make it right.
Anticipating further push towards $180
Trading with the trend.
Time sensitive
Price currently at key level.

AAVE, aims for X10 this bull season. Massive loans demand ahead!Aave is an Open Source Protocol to create Non-Custodial Liquidity Markets to earn interest on supplying and borrowing assets with a variable interest rate.
The apparent market shift in trend this past few days in the whole market after the extended correction is a good season to seed on this very valuable COIN.
Demands in LOANS will skyrocket fueling funding frenzy on position takers on their crypto holdings as we enter BULL SEASON. And the focus will be on AAVE the largest liquidity pool provider.
Ideal seeding zone is at the current bargain range of (170) which started on the 130 bottom price area.
Get positioned now on this one while its still at early stage. An easy x10 would the long term target on this. Fundamental and Technical growth on this is inevitable.
Spotted at 170.
Mid target 500
Long term 1000.
TAYOR. Trade safely.

aave short to $158.3 areaJust hopped into a aave short. I think the market is quite high right now and is in need of a correction and it seems which I think will likely happen to night.
MUltiple times price tried to break higher but more supply kept coming in. HHs kept failing.
Also its probably more ideal to short in the nights as in the day everyone is quite bullish or uncertain and lots of news be coming out to interfere with price action

AAVE - Alt Rising Star?Aave is a unique option in the alt coin universe. It's technology facilitates access to accelerated gains in a rising price environment, and with the recent release of a stable coin, Aave has positioned itself as a more serious player in the cryptoFi space.
Will Aave trend to the upside from here? Time will tell...
For now, our team has identified an opportunity within AAVEUSDT, where momentum may very well be turning to a 'bullish' rating should price be able to hold current levels - Caution as always is warranted.
We do however see elevated risk of 'bearish' momentum coming into play below the $129.00 mark.
We're inspired to bring you the latest developments across worldwide markets, helping you look in the right place, at the right time.
Thank you for reading! Stay tuned for further updates, and we look forward to being of service along your trading & investing journey...
Disclaimer: Please note all information contained within this post and all other Bullfinder-official Tradingview content is strictly for informational purposes only and is not intended to be investment advice. Please DYOR & Consult your licensed financial advisors before acting on any information contained within this post, or any other Bullfinder-official TV content.

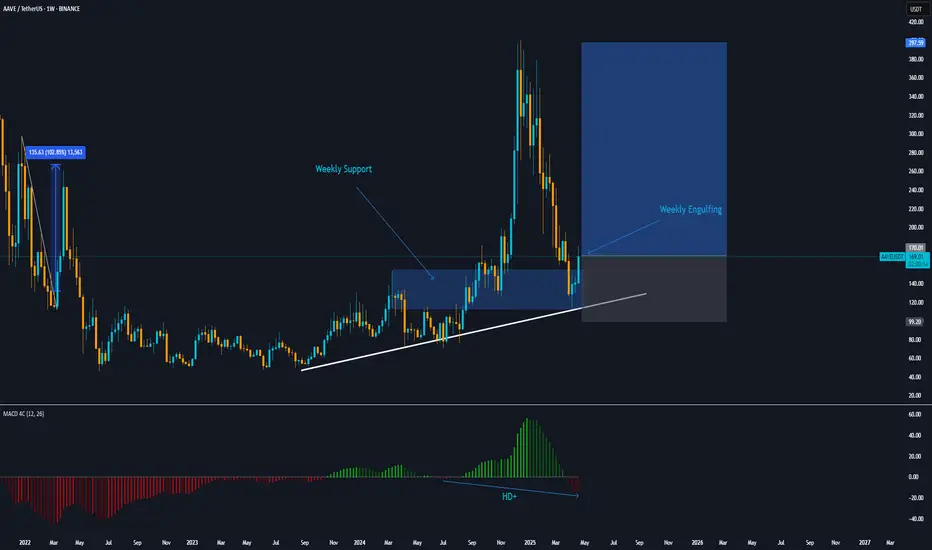
AAVEUSDT is ready to begin an UptrendWith the closing of a strong bullish candle and its engulfing, we can expect the price to grow to its previous high price range.
TradeCityPro | AAVE: Key Triggers in DeFi Lending Giant's Trend👋 Welcome to TradeCity Pro!
In this analysis, I want to review the AAVE coin for you. The AAVE project is one of the largest DeFi projects, operating in the lending sector, and holds the highest TVL among all projects in this category.
✔️ Currently, the coin of this project has managed to achieve a $2 billion market cap and with this market cap, it ranks 39th on CoinMarketCap.
📅 Daily Time Frame
In the daily time frame, as you can see, after a long-term uptrend that reached up to 383.59, the price entered a corrective phase and, following the break of the 278.56 zone along with a descending trendline, dropped to the 124.31 level.
💫 The 124.31 support is a very strong one, and the price has reacted well to it. The buying candle volume has increased after the price reached this zone, which indicates the strength of this support.
💥 If this support breaks, the price could begin its next bearish leg. The next support that AAVE has in this time frame is at 77.45, which could prevent further decline in case of a sharp bearish move.
📈 For a long position or spot buy, we first need to wait for the descending trendline to break, and for the price to form a higher low and high above this trendline to confirm a trend reversal.
🔼 Currently, the main bullish trigger is at the 194.97 level, and if this level breaks, the price could move back toward the 278.56 and 383.59 zones.
📉 For a futures position, the 148.17 level is a suitable trigger and can offer a risky long position. However, the spot buy and main position trigger is the 194.97 level. A break of the 50 level on RSI would bring bullish momentum into the market and can serve as a good confirmation for a long position.
🧩 For a short position, breaking the 124.31 level is a good trigger, and if this level breaks and RSI enters the oversold zone, the price could make a sharp bearish move.
📊 But more important than all is the market volume, which currently doesn’t have a clear trend. We’ll have to see whether, upon breaking 124.31 or 148.17, sufficient volume enters the market or not.
📝 Final Thoughts
This analysis reflects our opinions and is not financial advice.
Share your thoughts in the comments, and don’t forget to share this analysis with your friends! ❤️

Potential Inverse Bullish Head & Shoulders! 📈 CRYPTOCAP:AAVE Update – Potential Inverse Bullish Head & Shoulders! 👀
CRYPTOCAP:AAVE appears to be forming an Inverse Bullish Head and Shoulders pattern, which could signal a bullish reversal! 🐂
⚠️ Watching for a breakout above the neckline (resistance) for confirmation.
🎯 Target: Green line level 👆

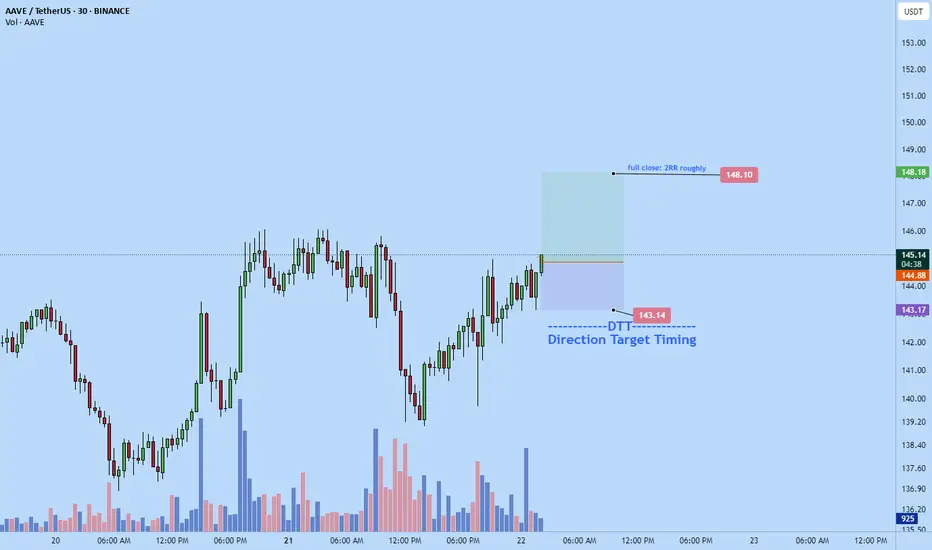
aave scalp long to $148.1Just now hopped into aave long. Anticipating a pump right now leading into new york session.
Time sensitive signal>
Stop: $143.14 area
Target: $148.1
DTT applied
Roughly 2RR
AAVEUSDT to head towards weekly resistance around 200The price has bounced from weekly support WS1 and currently trading above it. The next resistance is weekly resistance WR1 sitting around 165-195 zone. The price is headed towards this zone and in coming days or weeks it is going to hit this zone. However, there should be some pullback there. The next resistance zone beyond WR1 is weekly resistance WR2 sitting around 235-255. It is possible that after having some pullback at WR1, the price will eventually break WR1 and aim for WR2. However, WR2 is going to be strong supply zone and will push the price down again. I see still a possibility for the price to come down from WR2 to test weekly support zone WS2. But thats quite far yet, therefore, lets stick to the movement till WR2 and then we reevaluate the price action based on the reaction when the price hits WR2.

AAVE (Aave): 100EMA Holding Price Down | Another Sell Incoming?Aave is seeing a good decline in price after each touch of the 100EMA, which we recently had again. We are going to look here for a decent movement to lower zones, which should give us at least 15% of market price movement; this, of course, only as long as we stay below the EMAs.
Swallow Academy

AAve long to $150Just now opened a long position on aave. Very high probability. Went in heavy
Anticipating a fast pump back up to $150 price target today.
Manage risk to what you can afford to lose if seeing this.
Might get a bit of drawdown but I anticipate it be quick if any

AAVEHere I see two possible scenarios. AAVE has been ranging for quite a while and I would be looking for shorting at 184 or long at 150. At 184 there is a clear OB which I would closely monitor if it holds and then short after confirmation. And at 150 I would wait for price to fill the breaker block and after confirmation enter the trade. I will be posting all of this free of charge as well as entries to my trades. Stay tuned.

AAVE/USDTThe coin is showing a bullish structure both locally and on the higher timeframes. Once the November low is swept, we can look for longs with a target at 194

AAVEUSDT SETUPHere is a trading idea that i think will take AAVE for a bull run, you can make your own further analysis and decision as this is not a financial advise, those are my level that im looking to buy since those leves holds supportive confluences

$AAVE solid bounceCRYPTOCAP:AAVE had a solid bounce off the lows and is now pushing into resistance. This weekly close will be key to confirm a reclaim of the 99 SMMA or a rejection.


Aave (AAVE): Expecting Overtake by Sellers at 200EMA Aave coin has recently broken from the 200EMA line, which has been holding the price down for quite some time now. We are looking for the price to retest that same EMA and fail the retest, upon which we will be trying to catch a downward movement to lower zones here.
Swallow Academy

AAVEUSDT 3DAAVE ~ 3D Analysis
#AAVE Buy back from here with a short -term target of at least 15% from here.

$AAVEUSDT | Bottom Formation Watchlist #long📉 BINANCE:AAVEUSDT | #2h Bottom Formation Watchlist #long
💬 Scanning altcoins for base-building signs after the markdown phase — EURONEXT:AAVE is one of the more interesting setups on radar.
🔍 Key Observations: — Price is hovering near a major support level
— Current bounce looks corrective, not impulsive
— No clear bottom structure yet — watching for potential continuation of the descending channel
— If a proper accumulation base forms (visualized on the chart), this becomes a long setup
— Target on breakout confirmation: $300+
⚠️ Until a clean structure prints, these are just weak bounces in a downtrend. Stay cautious — no trigger, no trade.

Can #AAVE Bulls Sustain the Current Momentum? Key Levels Yello, Paradisers! #AAVE looks bullish on the surface—but is this setup quietly setting up for a brutal dump? Here's the key level that will trigger the next big move:
💎#AAVEUSD is currently trading around $143.66, holding inside a clear ascending channel on the 4H timeframe. The price action of #AAVE has been respecting both the ascending support and resistance trendlines, forming higher lows and higher highs—but momentum is fading.
💎A bearish divergence on the momentum oscillator is signaling early weakness despite the price climbing higher. This divergence usually marks the beginning of a bull trap, where the price appears strong just before a sharp reversal.
💎The immediate resistance to watch is in the $156. This is where price was recently rejected, near the upper channel trendline. Above that, $156 remains the key Bearish Setup Invalidation level. A breakout and hold above this would invalidate any bearish structure and could lead to a push toward $170+.
💎However, if AAVE breaks below the ascending support, currently near $140, it opens the door for a sharp drop. The first target is the $126.10 support zone, followed by the $114.35 level, which aligns with a strong historical demand area.
Play it safe, respect the structure, and let the market come to you. Discipline, patience, and strategy are what separate long-term winners from short-term gamblers
MyCryptoParadise
iFeel the success🌴

AAve long to $143-$148. UrgentI think based on my analysis that aave will return to $143 this weekend, and if the demand is strong enough it might just break through and push to $148.
Also, I might scale into this position later on before $143 tp

AAVE DAILY ANALYSISHi friends,
Today, we analyze AAVE in the Daily time frame.
As we had its analysis in the past weeks, the downtrend channel is still holding the price.
We have a good entry point for long positions at $156, which needs confirmation that it has broken the downtrend channel from the upper side.
Also, as mentioned in the past analysis, we have a strong accumulation area ranging from $118 to $150.
Also, the level of $118 is ideal for short positions, which in such cases, if the channel is broken from its Lower Side, we may have parabolic moves towards down.
For spot trading, we have the level of $195, which is a key turning level for gaining its bullish momentum.
As you can see, the volume has been going up in the last couple of weeks.
