ADAUSD Potential for Bullish Rise| 20th January 2023Looking at the H4 chart , my overall bias for ADAUSD is bullish due to the current price being above the Ichimoku cloud , indicating a bullish market.
Price has tapped into my pullback buy entry at 0.3294, where the overlap support and 38.2% Fibonacci line is. Stop loss will be at 0.3067, where the support and 50% Fibonacci line is. Take profit will be at 0.3808, where the overlap resistance is.
Any opinions, news, research, analyses, prices, other information, or links to third-party sites contained on this website are provided on an "as-is" basis, as general market commentary, and do not constitute investment advice. The market commentary has not been prepared in accordance with legal requirements designed to promote the independence of investment research, and it is therefore not subject to any prohibition on dealing ahead of dissemination. Although this commentary is not produced by an independent source, FXCM takes all sufficient steps to eliminate or prevent any conflicts of interest arising out of the production and dissemination of this communication. The employees of FXCM commit to acting in the clients' best interests and represent their views without misleading, deceiving, or otherwise impairing the clients' ability to make informed investment decisions. For more information about the FXCM's internal organizational and administrative arrangements for the prevention of conflicts, please refer to the Firms' Managing Conflicts Policy. Please ensure that you read and understand our Full Disclaimer and Liability provision concerning the foregoing Information, which can be accessed on the website.
ADABEARUSD trade ideas

ADAUSD Potential for Bullish Rise| 20th January 2023Looking at the H4 chart , my overall bias for ADAUSD is bullish due to the current price being above the Ichimoku cloud , indicating a bullish market.
Price has tapped into my pullback buy entry at 0.3294, where the overlap support and 38.2% Fibonacci line is. Stop loss will be at 0.3067, where the support and 50% Fibonacci line is. Take profit will be at 0.3808, where the overlap resistance is.
Any opinions, news, research, analyses, prices, other information, or links to third-party sites contained on this website are provided on an "as-is" basis, as general market commentary, and do not constitute investment advice. The market commentary has not been prepared in accordance with legal requirements designed to promote the independence of investment research, and it is therefore not subject to any prohibition on dealing ahead of dissemination. Although this commentary is not produced by an independent source, FXCM takes all sufficient steps to eliminate or prevent any conflicts of interest arising out of the production and dissemination of this communication. The employees of FXCM commit to acting in the clients' best interests and represent their views without misleading, deceiving, or otherwise impairing the clients' ability to make informed investment decisions. For more information about the FXCM's internal organizational and administrative arrangements for the prevention of conflicts, please refer to the Firms' Managing Conflicts Policy. Please ensure that you read and understand our Full Disclaimer and Liability provision concerning the foregoing Information, which can be accessed on the website.

ADAUSD: Bump and Run Reversal TopADA has Bearish Divergence on the MACD and RSI and seems to be topping out and breaking down out of a BARR Top and may atleast get a 10% move down in the coming days

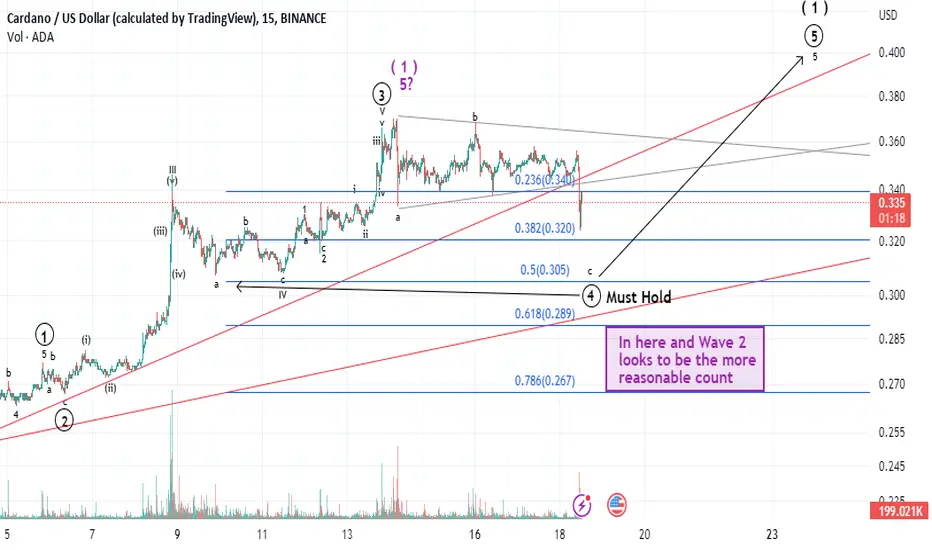
ADA Update: Triangle InvalidatedEarlier today I posted ADA looks ready to complete wave 1 up at $.39 level. In what looked like a clear triangle for wave iv of 5 has been invalidated with this move down. Therefore we have several ways to interpret this pattern.
First this is still wave 4 and nothing there is invalidated and the $.39 target area for wave 1 is still in play. Second, wave 1 is complete.
If my primary black count is playing out, we must hold the wave 4 of one lesser degree (indicated on the chart). If we get below that and then subsequently into the purple target box, then this is a larger wave 2 retrace.
Having just updated on ADA and identified in what looked like a triangle...I wanted to inform my followers due to recent price action, where we are.
Best to all,
Chris
CARDANO ADA symmetric triangle Cardano made a nice push up and Now on the hour a trapped in a symmetrical triangle. 50/50 breakout chance and pay attention to the MA50 on this timeframe we are dancing around it now. Should we really get below it with a clear rejection then that could bring the price further down. Both the price target of the symmetrical triangle and the MA200 meet with it.
Yet we also see a downtrend in the MACD and it is desirable that it would remain above the midline to remain bullish. for both scenarios it is desirable to see a re-test but is not a must.
Keep calm, do your own research, trade safe and manage your risk.
(Disclaimer: This is not financial advice)

Morning Update: ADA poised to complete wave 1 at $0.39In what appears to be a clear wave 4 triangle, ADA appears ready to launch 10%-15% higher to complete this initial pattern off the bottom. From there we would expect a wave 2 retracement. I'll say this in advance as to not give any of my followers the improper expectations.
Wave 2's are far more unpredictable than any other corrective patterns. That is because of alternation with wave 4's. This means wave 4's take cues from wave 2's. A wave 2 can be deep....or shallow. Whereas you do not get the complex patterns associated with wave 4's, you do get the deep-shallow uncertainty. Lastly, there are many posts on trading view about crypto having not bottomed.
That is not my viewpoint as it pertains to Cardano. I believe ADA had bottomed.
If you choose to trade out of ADA you do so with the risk of a wave 2 being shallow and being left behind. However, with all things regarding your trading...these are your decisions.
Best to all,
Chris

Financial Wave. ADA(Cardano)Our priority scenario in Cardano once again led to these goals, and we continue to follow it. In our opinion, wave iii is developing in ADA, which can bring prices to $0.4307. If the price of Caradano drops below $0.3323, this markup will change.

ADAUSD 60 % drop coming - be ready!Many persons won´t like this idea but the fact is that ADAUSD remains in the downtrend.
Small bounce only to get rejected from the downsloping resistance line is still possible but generally we expect ADAUSD to continue its downtrend as other alts most likely will do.
- September is usually bloody for crypto
- BTC.D at the key support - bounce expected which would be bad for altcoins market.
- every bounce to the downsloping resistance line is a short opportunity.
- if the price reach our buy zone, it would be a 95 % drop which is similar to drops that we saw for many alts in the 2018/19 bear market
- Be patient!

ADAUSD - Upward move coming - 2023!It looks like Cardano it's going to start 2023 well.
On the 4-hour timeframe chart(left), Cardano's price is showing Regular Bullish Divergence. The Divergence is indicated by the Relative Strength Index and the Stochastics.
On the daily timeframe chart(right), Cardano's price is showing an Oversold condition. The Oversold conditions are indicated by the Bollinger Bands, Relative Strength Index, and Stochastics.
Both charts complement each other. The new innovative plans for 2023 are in line with these ideas as well.
Enter your long position only if/when the candle closes above the key level and confirms it as a support.
All further details are shown on the charts.
Good luck!

Cardano (ADA): a new fork is comingNews released during the last week from Input Output Global (IOG) supported ADA`s price during the previous week, in line with general market optimism after data showed slowdown in the US inflation. Namely, Cardano developer announced a release of a toolkit which would allow developers to build side chains, and increase scalability of the Cardano`s network. ADA made a significant move to the upside during the week, starting around $0.27 level and reaching a short term resistance line at $0.35.
Significant push in price, supported by increased trading volumes, moved the RSI indicator to the clear overbought side of the market. The indicator is currently moving around level of 78, which is a heavy overbought side. This is also an indication that short term reversal might be expected in the coming period. At the same time, there is no change in movements of MA50 and MA200 indicators, as they still continue to flow as two parallel lines and still with a downtrend.
ADA was supported during the previous week with both increased market optimism and announcement of a new fork. It will take a few days until the market calms down, in which sense, the price might start the week ahead with continuous testing of $0.35 resistance. Since the RSI reached a heavy overbought side, it decreases the probability that the price might go much higher from current levels. In case that the coin enters into a short term reversal, the support line at $0.30 might be tested.

Neutralif we succeed in breaking the downward trend , we can reach the targets of 0.40-0.42-0.50-0.57-0.64 .
But if we do not succeed , our first support will be in the range of 0.33


CARDANO Historic Cup & Handle slowly starting the new BullCycle?Cardano (ADAUSD) is having a good start for the year as the price is about to hit the 3D MA50 (blue trend-line). This is the level that has been unbroken since November 15 2021, basically throughout almost the whole Bear Cycle. As you realize a break-out above it would be a major bullish development for Cardano. Such a break on January 07 2019, was what effectively confirmed the start of the previous Bull Cycle.
At the same time, the RSI broke above its Lower Highs trend-line, which is exactly what happened this week. As you see, based on the Jan 2019 fractal, an RSI pull-back now would mean short-term loss of strength for ADA but when a full 3D candle closed above the MA50, the price made the break-out towards the 3D MA200 (orange trend-line). Its target was the 0.382 Fibonacci and this is what we will target (0.6400), in case we get that candle closing above the MA50.
This time however, ADA has another strong pattern to support the idea of a new Bull Cycle and that is its historic Cup and Handle (C&H) pattern that has been trading in since January 2018. As you see, the current Bear Cycle (being within a Channel Down) can be viewed as nothing but the Handle of the Cup. Technically the target on such patterns in extremely high, which would be unrealistic based on its market capitalization, but holders can finally start believing a little more to new All Time Highs for ADA. For now take a quarterly step at a time and use the 0.382 Fib and 3D MA200.
-------------------------------------------------------------------------------
** Please LIKE 👍, FOLLOW ✅, SHARE 🙌 and COMMENT ✍ if you enjoy this idea! Also share your ideas and charts in the comments section below! **
-------------------------------------------------------------------------------
💸💸💸💸💸💸
👇 👇 👇 👇 👇 👇

ADA: Potential Targets AheadOn the weekly chart, ADA has been forming a wedge pattern since May 2022, which has finally broken out. If the bullish momentum continues, the next major resistance zone would be around $.40 - $.43.
Invalidated if it falls below the trend line.

Cardano analysis and best entry points for next bull run Our chart for today will be cardano as I believe this coin may provide a very good risk to reward ratio. And always check the volume analysis so you don't pay higher prices for assets.

Financial Wave. ADA(Cardano)Our priority scenario in Cardano remains the same: a rise in wave V could take the price to $0.3630. A price drop below $0.3006 will reverse this scenario.

ADA about to break out the descending trend since 2021The ADA USD monthly chart is showing that the ADA price action is about to break out the monthly descending trend since 2021 (nearly two year of bear trend). We need to have confirmation after a few week, but, as seen in the monthly RSI, the ADA price action has touched (a few weeks ago) the lowest point in history (in December 22nd 2022). This might be a bullish sign.


How To Swing Trade CardanoAfter twenty five years trading this is my favorite strategy to trade Cardano .
The 8 hour time frame is ideal for swing trading with three potential signal periods a day. This accounts for the Asian, European and American sessions allowing you to have the rhythm of the market. The 8 hour also does a fantastic job filtering our noise while holding trends yet giving you early warnings of trend changes to get out.
I highly recommend this for something willing to put in the extra work required to swing trade for the extra profit potential it offers.

HOMERUN 2022-2024 | For Serious Folks Only
plant now and maybe just maybe 100 days later shall be rewarding
approaching June 2022...
note: expect Drawdown by December Jan for re balancing towards first quarter boom run
have a dormant account for retiremnt
and open a dedicated trading account to squander and keep yoursel entertained .
==
these are just samplers with not much liquidity or pretending to be dead
good lucks and keep safe LEGENDS..
your friend
Senyor


Cardano is losing its footing.ADA is under support, if a predator sees a weakness, it will try to attack.

ADA ; update ; looks like a full blown turdADA ; update ; looks like a full blown turd
that double bottom i was looking for fell to pieces. s and p etc looks to be wanting to at least double bottom, sweep the lows as well. they are gonna darth maul this shit while everyone is getting christmas drunk and eating too much. hard to think when your in a carb coma.
knife catching the potential capitulation wick would be sick; make sure you do it on low enough leverage that you don't get blown out when it tripple wicks on the lower time frames.
15-18c ish looks like the sweet spot if history repeats. so far its looking pretty friggin similar.
i think you will have time to buy that dip, no need to go full degen and watch this shitshow of an asset class every second.
gl to you gentleman and ladies. have a good christmas/new years with your families/friends.
