ADA Caution!Considering cycle theories and assuming Altcoins - especially those from 2015-2017 - could be in different corrective phases than Bitcoin, investors could be in a big surprise for the next upcoming months. While Bitcoin is potentially in its last cycle (retail wave 5) before its first major correction, the older Altcoins are still in their wave 2 which results in a long exhaustive ABC phase and often corrects more than 50% of the first impulsive wave which would also coincide with the 1.618 Fib.
This would mean that alt-season - for the older big coins - is not here yet. Regarding their meteoric rises after more than 10k% the fundamentals need to catch up to overvalued prices, which takes time.
A lot of people are confused and complaining about the "blue chip coins" not going up, especially Cardano, while Market Makers play the long game and suppress Altcoin prices artificially, simply keeping them in a big trading range and in corrective mode till their first cycle ends and the next begins.
ADA e.g. shows striking resemblance to NEM (XEM) with a similar corrective structure and sits on long time life support. The more it pokes on it the more it's gonna get dangerous for the next breakdown to the 0.10-0.20$ region.
ADABULLUSD trade ideas


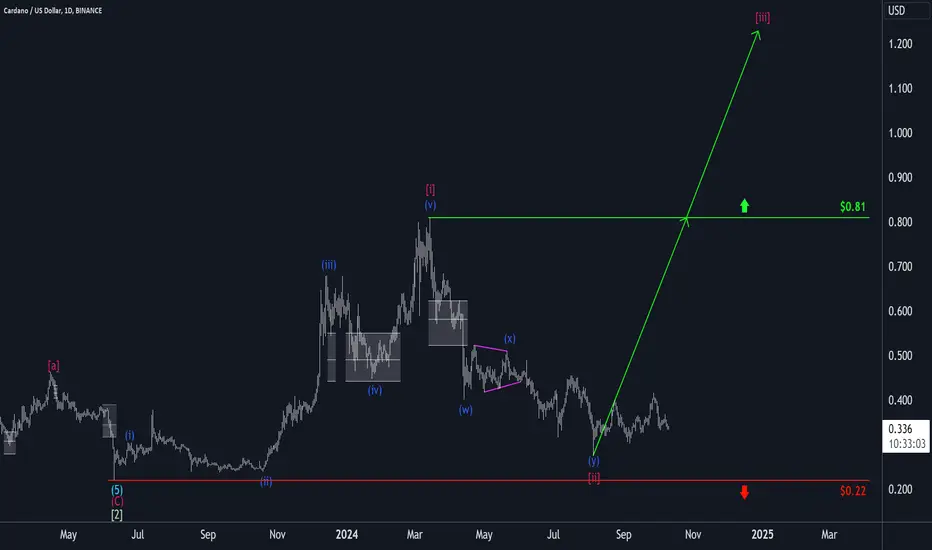
Cardano: FlatlandsCardano showed little volatility last week, moving mostly sideways. We still expect it to rise in magenta wave (iii), surpassing the resistance level at $0.81. Only our 38% probable alternative scenario could disrupt this plan. This alternative scenario will come into play if the price drops below the support level at $0.22, implying a deeper low for green wave alt.(2)

ADA Leading Diagonal From August Low We are currently working on Wave 5 of a leading diagonal target price being just below 0.42.

CARDANO BULLISH OUTLOOK We have reacted to a very strong demand level; as seen by the wicks on the candles ; Ada is ready to take off

Cardano ready for its Bullish move We have been accumulating for some time; but simply put we had a break of the previous high; we have now retraced into the Demand Zone that caused the break of the previous HIGH ; indicating that we are ready to continue this bullish momentum #ADATOTHEMOON

Cardano: Potential Cup and Handle Signaling a Bullish Breakout?In recent weeks, ADA Cardano has shown signs of forming a classic "cup and handle" pattern, often considered a bullish continuation signal in technical analysis. The gradual U-shaped consolidation (the "cup") suggests that the market is absorbing selling pressure, potentially paving the way for an upward breakout. The "handle" formation, characterized by a slight pullback, may act as the final consolidation before a significant price surge.
Traders often look for volume increases during the breakout from the handle, which can indicate strong momentum. If the pattern completes successfully, Cardano could see a strong upward rally, supported by bullish fundamentals like network upgrades and ecosystem developments.
While technical patterns like this one can provide valuable insights, it’s important to consider the broader market environment and potential resistance levels ahead to assess ADA's longer-term potential.

Cardano - Sell Idea (Short-term)The break back below 0.3590 suggests that price action is entering a short-term trading range with more back and forth exchanges. At this point, price action is more likely to continue south, towards the next local support at 0.3398.

CARDANO - Buy Idea (Short-term)The nice turn around off of the key-level support at 0.3370 (again) suggests that price action is gearing up for and upside reversal, at least on the short-term scale. We're recycling the target of 0.3569.

#ADAUSD 1DAYADAUSD (Cardano vs US Dollar)
Timeframe: 1 Day (Daily Chart)
Pattern: Uptrend Channel
Description:
The ADAUSD pair is currently exhibiting a well-established **uptrend channel** on the daily chart. This pattern is defined by a series of higher highs and higher lows, with the price consistently moving within two parallel ascending trendlines. The lower trendline serves as dynamic support, while the upper trendline acts as resistance. The price action within this channel indicates that buyers are in control, with bullish momentum driving prices higher over time.
Forecast:
The recommendation is to take a **buy** position, as the price is expected to continue moving upward within the channel. The trend shows strong bullish signals, and unless there is a break below the lower support line, the uptrend should persist. If the price approaches the upper resistance line, it may face some temporary consolidation or correction before continuing higher.
Entry Point: A buy entry is suggested near the lower support of the channel for optimal risk-reward.
Stop-Loss: Place a stop-loss slightly below the lower support line of the channel to mitigate risks in case of a downward breakout.
Take-Profit: The take-profit target should be set near the upper resistance line of the channel, or you may trail your stop-loss to lock in profits as the price advances. A breakout above the resistance line could signal further upside potential.

Cardano: SluggishADA has yet to achieve consistent gains. Primarily, we still see it in the magenta wave (iii), which should drive it above the resistance level at $0.81 as it progresses.
What i think will happen to ADAThis is what i think will happen to ADA. Next bullrun will happen only in end of 2025 or begining of 2026, and will reachbetween 6$ and 10$... and then fall between 3$ and 1,5$

ADA | Back to bear market lows, or back to your portfolio?ADA has been out of the top 5 cryptos for a while and largely out of the spotlight. But is that about to change? Let’s dive into a few key factors that could offer insight into what’s coming next.
-- Support & Resistance
Currently, ADA is trading near the bottom of its range at around $0.34, a key level that has historically divided bull market price action from long-term bear market accumulation since 2022. In a bull market, this is the kind of price level investors can only dream of buying at. However, with Bitcoin consolidating at its previous cycle’s all-time high for the past seven months, altcoins have suffered, allowing prices to fall to these accumulation-friendly levels.
The top of the range sits between $0.40 and $0.43, where we've seen two rejections and one false breakout. Despite this, I wouldn’t lean towards a bearish outlook, as we’ve had two false breakouts and three successful support holds, suggesting bulls have more control over this range.
-- Trendlines
As shown on the chart, ADA is forming a large pennant pattern, a key signal of potential consolidation before a significant move. Currently, the price is testing the lower trendline of this pennant, which aligns with the range’s support level. This convergence provides strong confluence, reinforcing the idea that we could see a bounce from here. The pattern's structure suggests that, as long as the lower boundary holds, ADA may be positioning for a breakout. Watching how price action reacts to this area will be crucial in determining the next move.
--
In conclusion, ADA is showing signs of potential strength at key support levels, both in terms of price range and trendline confluence. With bulls maintaining control over the range and a possible breakout on the horizon, the upcoming price action could signal a shift back into the spotlight for ADA.

ADAUSD Breakout confirmed. Target 1.0500.Cardano / ADAUSD has broken above the Descending Triangle pattern and despite a pull back on the 1day MA200, it is now resuming the uptrend.
This is a similar price action with 2023. Break above Triangle, consolidation before the 1day MA200 break and then huge rally to the 2.618 Fibonacci extension.
Buy and target 1.0500.
Previous chart:
Follow us, like the idea and leave a comment below!!

CARDANO - Buy Idea (Short-term)The nice turn around off of the key-level support at 0.3370 suggests that price action is gearing up for and upside reversal, at least on the short-term scale. Our target is at 0.3569.

Golden CrossOn Saturday, 9/28, a golden cross formed where the 20 MA and 200 MA crossed. We will see if the 200 MA will play the break to stake a long position. It is currently being pulled back to retest its value. Good buy-in point to TP for the coming weeks. Support - 0.34 Resistance 0.46

ADA ready to for lift off!I have taken ETH's first DeFi bull run and laid the bar pattern into 15 months ahead. I think ADA is gearing up now to begin this HUGE run! Not financial advise! God Speed!

[ADA/USD] Cardano attempting to enter bullish zoneA breakout from downtrend line on daily chart, BINANCE:ADAUSD is now meet with its 220EMA & trying to break above it to officially enter the bull territory.
As precaution, do prepare a rejection on 1st attempt. A bullish theme nevertheless.

CARDANO flashing the strongest buy signal in 1 yearCardano (ADAUSD) just gave the strongest long-term buy signal possible on the 1W time-frame as the 1W LMACD is forming a Bullish Cross. That is the first such formation in almost 1 year (since October 09 2023), indicating that we have the most powerful buy signal at hand.
The 1W RSI has been ranging since May, practically for the majority of the time that ADA has been trading below its 1W MA50 (blue trend-line).
Basically as you can see all the above conditions are identical to the previous Bull Cycle, where a Bullish Megaphone emerged on a 1W LMACD Bullish Cross and after a 1W MA50/ MA100 Bullish Cross, the bottom was formed, while the 1W RSI was consolidating.
This time we have all these formations emerged again, so any week now, Cardano could start its new Parabolic Rally. With a Higher Highs trend-line setting a clear Resistance, we see a $5.00 price as a strong Target for the Cycle Top.
-------------------------------------------------------------------------------
** Please LIKE 👍, FOLLOW ✅, SHARE 🙌 and COMMENT ✍ if you enjoy this idea! Also share your ideas and charts in the comments section below! This is best way to keep it relevant, support us, keep the content here free and allow the idea to reach as many people as possible. **
-------------------------------------------------------------------------------
💸💸💸💸💸💸
👇 👇 👇 👇 👇 👇

Cardano - Buy IdeaCardano looks ready to move to the next stage of this current bull cycle. The clear break above the key-level resistance of $0.3500 is the trigger we were waiting for. Firing off a new buy position, targeting the next big resistance of $0.4230

ADA: Bearish ideaADA is not putting in the impulse moves that it needs to get out of the $0.24 - $0.4 range. It is looking more likely that price will retest the bottom of this range, and maybe breach it a little to reset the rout. There are many good things happening to the chain but price is not reflecting it.
The black count reflects the bearish idea. In this count we assume primary wave 2 is not yet complete and the 5 waves move up was the C of X. The price action right now should be one last leg down to complete wave 5 of C of Y. Price can go down back to $0.2 - $0.18 to test back 2021 consolidation structure. For me, this will be a major buy area if this plays out.

Cardano: RegenerationADA has recently recovered somewhat, meaning that our primary scenario remains unchanged. We continue to locate the coin in the magenta wave (iii), which should ensure gains above the resistance at $0.81 in the further course.

