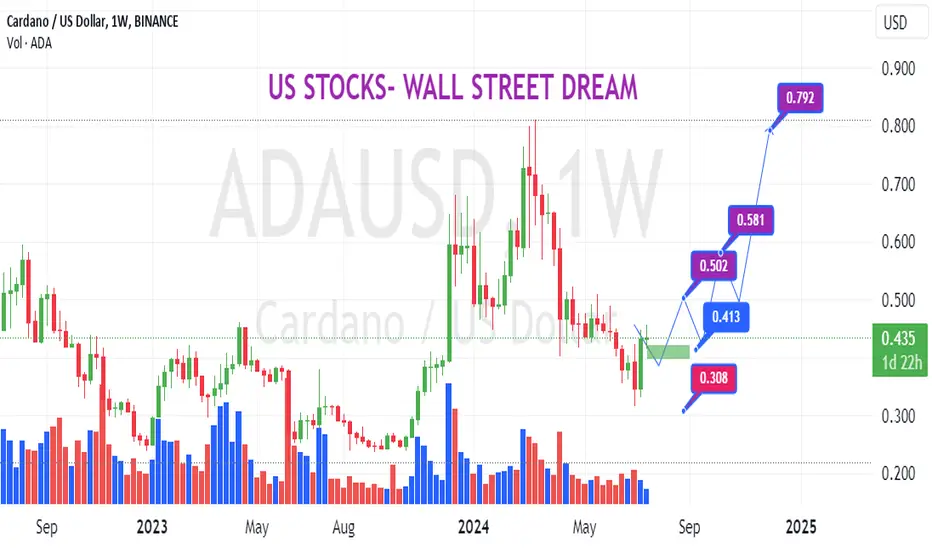
The Bullish Case for Cardano: A Strategy to Maximize Your GainsMarket Recovery
The overall crypto market is bouncing back, with ADA recently seeing a nice price increase of over 4%. This shows that investors are gaining confidence.
Key Price Levels
ADA is approaching the important $0.70 mark, and many traders are watching for it to break through to $1. This could signal further gains.
Exciting Developments
Cardano has made some exciting upgrades, like the Hydra scaling solution, which makes the network faster and more efficient. This could attract more users and boost its value.
Trading Strategy
As always I plan to use a probability-based approach to enter long positions. This means I’ll look for the best entry points while managing risk effectively based on X1X2 strategy and its indicators.
Take a look at these analyses to see the details behind this trade idea.
12M:
3D:
10H:
ADABULLUSD trade ideas

Cardano ADA has one more time touched the bottom areaCardano ADA has touched the bottom area one more time on the monthly ($0,25 - $0,35). With all the new functionality in the latest forks and excellent performance (Hydra), ADA will likely get up to $8 in this bull market, hitting this target between July and September 2025.

Cardano - [ADAUSD]Overall Trend :
The chart shows a clear downtrend from the peak in early March to the current date. The price has fallen from around $0.80 to current levels near $0.35.
Price Action :
There's a significant drop from mid-April to early May.
The price has been consolidating in a range between roughly $0.30 and $0.45 since June.
Recent price action shows some attempts at recovery, but resistance is encountered around the $0.40-$0.45 level.
Support and Resistance :
Key resistance levels appear to be around $0.45 and $0.50.
Support seems to be established around $0.30-$0.32.
Volume :
Volume bars at the bottom show higher trading activity during price drops, suggesting selling pressure.
Recent volume is relatively low compared to earlier in the year, indicating reduced trading interest.
Bollinger Bands :
The green lines surrounding the price action appear to be Bollinger Bands.
The price has been trading mostly within these bands, with occasional touches of the lower band.
Recent Movement :
There's a small uptrend visible in the last few days of the chart, with the price moving from the lower Bollinger Band towards the middle.
Potential Outlook :
The overall trend remains bearish, but the recent consolidation and small uptick could suggest a potential for a short-term bullish move.
However, significant resistance needs to be overcome for a trend reversal.
It's important to note that this analysis is based solely on the technical aspects visible in the chart. Fundamental factors, market sentiment, and broader economic conditions should also be considered for a comprehensive investment decision.

Crypto Analysis, Xinyi and ABCL UpdateMost crypto coins are showing good bullish setups which I will use to add to my positions. Xinyi still has room to add to a long position. ABCL stock that I have recommended before is not showing any positive signals so I won't add but at the same time I won't close my position.
Disclaimer: Not a financial advice. Do your own analysis

Why not coinsI don't believe crypto will be the future of finance, like I once did.. Mostly because that change hasn't happened in the real world with your everyday stores and purchases using it world-wide.
The people that sold on the way past 10k-20k-60k etc. are all out of the game and now we could easily run it the other direction, crushing bulls dreams along the way.
Ultimately I feel crypto will fail, but just incase I'm wrong and the USD does crash in the coming years, then at least I've got a few cheap coins, that should take off and skyrocket, if the USD flops.
Shown here is a Gann Square laid on the Weekly chart to a squaring method that's fairly common but I've modified slightly. Inside the square are 10th's ratios within a Gann Box. Lastly Elliot Wave ABC corrective wave on the weekly chart has satisfied all of my rules and could very-well be pushing this market into new higher highs.

Ready to Move?Here we go! Things look ready to move relatively soon.
-Volume decreasing linearly, usually the sign that big players have taken their profits and steered price action the way they wanted. Sets up for the next big move.
- Fisher ribbons aligning, can give direction and strength of a move when combined with other tools
-Volatility decreasing, a sign that a relatively large move is coming
- Stochastics pointed in the positive direction with low volatility usually means price action will break that same direction
-FED to cut interest rates in September
Question is, what will we do if it breaks to the downside...
ACCUMULATE,
Seanders

ADA primed for breakoutADA is retesting the top of this falling triangle pattern! I this looks very similar to October 2023!
The yellow box is the trap zone for the breakout. If we can get above it the Red box is the BIG test!


ADA FractalThis is a fractal from over two months ago. It's pretty crazy how close it's been to what has transpired. I don't necessarily think it's going below 30 some cents, but the fractal definitely indicates a big drop coming. It will be interesting to see it play out. If you look back, it's been very close to predicting movement for the last 2+ months.

ADAUSD - 4hr (Golden Cross)Price action respecting the 4hr moving averages currently. Will need to retest lower after the golden cross. Price action might look something like this for the next week or so.

ADA - weekly is TIGHTThe moving averages are getting tighter and tighter for ADA, which typically leads to big moves. What I'd like to actually see is these get even tighter, so spending another month or two in this .45 - .60 cent region will actually lead to a bigger move long term. PRICE TARGET $1.25-1.75 AUG-NOV timeframe.
What I expect to see is BTC shoot up to 83k in the next couple weeks, then 125k after that. I expect a big blow off top for BTC towards the end of the year. ADA will not keep up in that time frame. After BTC's high, then it will be alt season. Thats when I expect ADA to potentially make new highs, but I am not too optimistic about that this cycle.
If you like to look at other instances of this set up, look at BTC and ETH weekly moving averages back in October of 2023. The majority of the moving averages were within a 7% spread. ADA is currently around 14% spread.

ACCUMULATE ADA - 5daySeems time to accumulate CRYPTO:ADAUSD if you are in the know about Cardano.
- Fisher Transform Indication bands need to align themselves.
- Price will bounce around tightly packed moving averages between .32 cents and .44 cents.
- Price breakout to occur early Aug to early September.
- Volume structure also indicates this breakout.
- Historical volatility also on the decline which also reinforces this breakout period.
ACCUMULATE,
seanders
not financial advise

Cardano (ADAUSD) Possible Bearish Move.Cardano on a downtrend, with a possible continuation for sells, price heading to the sell zone after a BOS.
Remember: Risk Management Very Important.

A potential decend trade on ADAUSD..Based on Elliot wave analysis, i saw ADAUSD has completed its wave 2, right at 61.8 fibo level, or it can be possibly find as wave B of its A-B-C correction. Either way, it's time to go up..
Take a look on the chart to see my 1st and 2nd target.
Good luck!
CHEERS!

Cardano to $7Everything suggests it's likely to happen. Cardano is a leading & innovative Blockchain technology & it's about to get decentralised. Chang HardFork.

Cardano (ADAUSD) Possible Bearish Move.Cardano on a downtrend, with a possible continuation for sells, price heading to the sell zone after a BOS.
Remember: Risk Management Very Important.

Accumulation - 8hrDespite what price action represents, ADA has been accumulated over the last 10 months.
Trust where the money goes, regardless of what they say to bring price down

ADAUSD- Preparing for a long up viewADAUSD- Preparing for a long up view
-Demand zone support.
-Tweetzer candles confirm bottom.
-Inversed HnS scenerios.
.
Wait and see!
ADA Expanded Flat correction?I am short-term bearish on ADA because, in the 15-minute timeframe, I can see a bearish divergence on the RSI. I will wait to see how it plays out before entering into a long position.
I am sharing my thought process on these market moves and adjust my analysis as the market evolves. This is not meant to be followed by others, as I am prone to mistakes like anyone else. Instead, I welcome feedback that can help me question and refine my analysis.

ADA, CAN IT BE PART OF THE DIGITAL GOLDRUSH?ADA chart
RSI favorable on smaller charts, not so favorable on bigger charts.
Potential to see a dip and BIG run.
One support trend.
Buy zone marked
Price targets marked
Potential to see a wick down to 10 cents, but lots of potential to hold that sub 30 cent price.
I'd be patient, and see what happens before jumping in, but having said that, short term could rocket the price, however, it really needs to clear 63, in my opinion.
I think the potential is there to see a quick drop to price targets and a run to all time highs, which aligns with a lot of the crypto market.

(ADA) CARDANO Strong signal indicating the price of Cardano is potentially heading upward. Variable exponential moving lines measured to create two lines that option the risk to favor a simple and direct approach to seeing a simulated trend ahead of time.

Cardan (ADA) to take a breather before moving higherSome key things to look out for on #Cardano 's daily chart:
◦ Major gaps between the bodies of the candlesticks and the Tenkan-Sen. The two don't like to be far away from each other, they're like an unhealthy co-dependent couple.
◦ Senkou Span B is the strongest level of support/resistance within the Ichimoku system.
◦ The RSI and DTO are at historical resistance levels.
👉 It looks like things might hover around here for the next few days while the Tenkan-Sen catches up to where price is presently at.
👉 That will give some equilibrium to be re-established before CRYPTOCAP:ADA makes another drive higher.
If there is a pullback, it should be limited to the $0.39 - $0.40 value areas.
tinyurl.com

ADA prepre LONG position for waves 5ADA prepre LONG position for waves 5 and preprep next one position for long term LONG good LL. I prepre PPContracts. L.
