ADA ANALYSIS🔮 #ADA Analysis - Breakout 🚀🚀
💲💲 In daily Timeframe,Falling Wedge Breakout is Done✅
But right now we can see that #ADA is trading around its crucial resistance zone and if #ADA breaks this resistance zone then we would see a bullish move 💯🚀
💸Current Price -- $0.4393
📈Target Price -- $0.7489
⁉️ What to do?
- We have marked crucial levels in the chart . We can trade according to the chart and make some profits. 🚀💸
#ADA #Cryptocurrency #Breakout #DYOR
ADAUSDT.3S trade ideas

Changing to down trend Changing trend
- big activity of selling markets
- point of reverse
- beating next reversal point
- failure to to beat line of resistance
- appear big volume

ADA D Update
Following up on my previous analysis, we finally have a candidate for a bottom.
Price is showing bullish RSI divergence, and is making a higher high in smaller timeframes.
A break of green resistance will give me a mildly bullish bias, for a test of blue resistance.
Breaking blue resistance is very bullish for me.

ADA: POTENTIAL FALLING WEDGE BREAKOUT!Hey everyone!
If you're enjoying this analysis, a thumbs up and follow would be greatly appreciated!
CARDANO(ADA) Looks good in the daily chart. It breaks from the falling wedge-like structure and looks ready for a 60-70% move to the upside. Buy some here and add more in the dip.
Entry range:- CMP and add more up to $0.394
Targets:- $0.454/$0.512/$0.568/$0.613/$0.684
SL:- $0.3636
What are your thoughts on ADA's current price action? Do you see a bullish pattern? Share your analysis in the comments below!

Cardano 1Day Timeframe - ADA/USDT.PADA/USDT.P 1Day Timeframe
Cypher Harmonic Pattern Completed. Waiting for good market structure shift and a good retracement at balance price range area. TYOR DYOR

ADAUSDT 1DAY TIMEFRAMECompletion of Bullish Cypher Harmonic Pattern for Cardano/Theterus. Waiting for good enrty. Entering at spot is also good. DCA . TYOR DYOR

ada short ada potential short on 12h order block
fundamentan analysis
orderblock
what do you think of this short?

ADAUSDT Trading Signal: SellDear Traders,
We have identified a trading opportunity for the ADAUSDT pair based on our analysis using the EASY Quantum Ai strategy. Here are the signal details:
Direction: Sell
Enter Price: 0.3959
Take Profit: 0.3852
Stop Loss: 0.4058
Justification for Prediction:
1. Market Trend Analysis: Our strategy indicates a bearish trend for ADAUSDT. Recent market activity shows a steady decline, suggesting potential for further downward movement.
2. Technical Indicators: Key technical indicators such as Relative Strength Index (RSI) and Moving Averages align with a selling trend. RSI is approaching overbought territory, indicating a likely downturn.
3. Volume Analysis: Decreasing buying volume coupled with a rise in selling volume reinforces the bearish outlook.
4. Support and Resistance Levels: The chosen entry and exit points are based on critical support and resistance levels. The Enter Price of 0.3959 is positioned just below a significant resistance point, making it a strategic entry for a sell position.
5. Risk Management: The Stop Loss at 0.4058 ensures that potential losses are minimized if the market moves against our forecast while the Take Profit at 0.3852 aims to capitalize on the identified downtrend.
Please make sure to adjust your trading size according to your risk appetite and financial situation. Remember, all trading involves risk, and past performance is not indicative of future results.
Happy Trading!
EASY Quantum Ai Team

Lingrid | ADAUSDT complex PULLBACK. SHORTBINANCE:ADAUSDT has been experiencing a downtrend, with each subsequent low and close being lower than the previous one. The market has been pulling back towards the round number at 0.400, which could potentially act as a significant resistance level. If the market rejects this resistance and the channel, as well as the downward trendline, I believe it's likely to continue moving down towards the support levels. However, when looking at the weekly timeframe, we see that the market has reached a demand zone and bounced off it. Therefore, I expect a only short-term retracement to occur. My target is a support level at 0.3690.
Traders, if you liked this idea or if you have your own opinion about it, write in the comments. I will be glad 👩💻

Cardano to $10?Last bull run CRYPTOCAP:ADA went pass the logical take-profit area at the 3.618 on the fib of $1.36. Conservatively speaking, this controversial coin is right on schedule en route to 3.618 on the fib at $10 by Q1 2025. Let me know your thoughts in the comments. Thank you.

Cardano is approaching the main trendHey Traders, in today's trading session we are monitoring ADAUSDT for a selling opportunity around 0.40 zone, Cardano is trading in a downtrend and currently is in a correction phase in which it is approaching the trend at 0.40 support and resistance area.
Trade safe, Joe.

Cardano (ADA): Possible Rejection Zone!Cardano is interesting after the break of the local support zone, where, as of now, Price is re-testing the broken zones.
On a 4-hour timeframe, we see that the candle is rather pushy, where we expect to see a rejection from current zones.
But if we somehow manage to fully break and secure that current zone of re-test, we will be looking for that 200 EMA zone near the upper resistance for the short position!
Swallow Team

ADA Target Analysis on a Monthly ScaleADA Target Analysis on a Monthly Scale
Disclaimer: This is not financial advice. These insights are based on my personal experience and technical analysis since 2017. Please conduct your own research and due diligence before making any investment decisions.

Ada usdt long..................I can see ada usdt long baseases of technical analysis ,SMC,ICT & sociology..

Cardano will Go Up AgainBINANCE:ADAUSDT
The price is at the bottom of the megaphone and at the same time it is in an ascending wedge, and after the wedge is broken, the price can grow well. Also, divergence in MACD makes this signal stronger.
✨Traders, if you liked this idea or have your opinion on it, write in the comments, We will be glad.
_ _ _ _ __ _ _ _ _ _ _ _ _ _ _ _ _ _ _ _ _ _ _ _ _ _ _ _ _ _ _ _
✅Thank you, and for more ideas, hit ❤️Like❤️ and 🌟Follow🌟!
⚠️Things can change...
The markets are always changing and even with all these signals, the market changes tend to be strong and fast!!

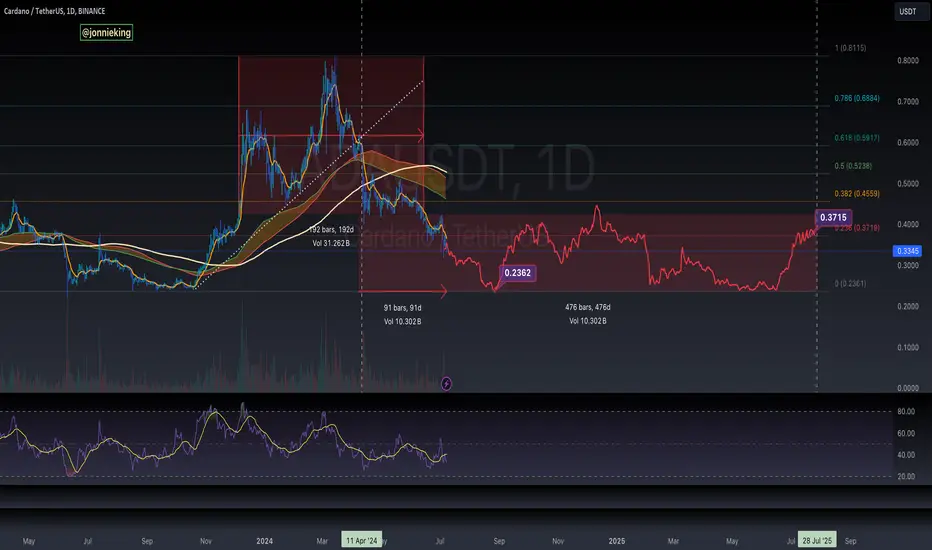
$ADA Chart FULL RESET AheadCRYPTOCAP:ADA has been extremely Bearish since April 11th when the 192 Day range cratered the price 35% over 4 days breaking the 200 MA
hasn’t been able to reclaim since, and cant even break the 9D EMA
Chart is on its way to a full reset.
Could be as much as a 476 day sideways range between $0.23 and $0.37 which is the .236 Fib
Hopefully by Q3 2025 Cardano can rally at the end of the Bull with the leftovers
ADAUSDT Update: Neutral Market Sentiment Hello there,
There is interest in buying ADAUSDT, but the bulls here appear to have a weakness in their ability to buy from the zone of 0.3948-0.3599 due to the low that was supposed to have been broken but did not break at 0.1614. There seems to be a lot of excitement for short-term gains and a loss of interest when examining candle patterns, with a mix of frustration and ambition apparent in the sentiment of the candlestick lows. Nothing appears to be definitive or clear on the news front, and traders seem to be mostly bullish.
If the price falls below 57.64RSI, bearishness will ensue, but it won't be strong enough until the RSI falls below its EMA.
Overall, the sentiment is neutral, as there are two open areas that can attract price movement; it's best to skip this one.
Happy Trading,
K.

CARDANO | ADAThe price of ADA is $0.4 today with a 24hour trading volume of 285 million dollar. This represents a 5.7% price increase in the last 24 hours and a 12% price decline since last month
Ada managed the breakout at 0.38 and had a huge buy volume and now the crucial EMAs (50, 100, and 200) accumulated between the $0.41 and $0.396 barrier accentuate the high resistance zone which needs to be breached for further recovery. RSI and most indicators shows that bulls are in control
Charles Hoskinson, the founder of Cardano, announced that Atala PRISM, the project’s decentralized identity solution, is being open-core adopted by an unannounced large open source foundation. This move aims to accelerate the commercialization of decentralized identifiers and enhance the adoption of secure, private identity management.Atala PRISM is built on the Cardano blockchain, offering a unique approach to identity management where users retain ownership of their identity and have full control over the use and access of their personal data. This decentralized solution ensures that data is shared only through secure, private peer-to-peer communication channels, making it suitable for businesses, governments, and individuals.
Atala PRISM offers numerous advantages for various stakeholders. Businesses can quickly onboard new customers, reduce compliance risks and costs, and deliver seamless user experiences. Governments can issue digital identities and enable instant access to public and private services. Individuals gain ownership of their identity and data, controlling how their personal information is used and accessed
are you bullish on ADA or you think we talking about a stablecoin !?

ADA#ADA Coin
This is a strong coin, and once it starts its upward journey, it won't stop before reaching the $3 levels.
It maintains its original uptrend on the weekly timeframe
Stop loss: Weekly close outside the uptrend

ADAUSDTCardano is a public blockchain platform. It is open-source and decentralized, with consensus achieved using proof of stake. It can facilitate peer-to-peer transactions with its internal cryptocurrency, ADA. Cardano's development began in 2015, led by Ethereum co-founder Charles Hoskinson.

Cardano Breakout And Potential RetraceHey Traders, in today's trading session we are monitoring ADAUSDT for a selling opportunity around 0.4100 zone, Cardano was trading in an uptrend and successfully managed to break it out. Currently is in a correction phase in which it is approaching the retrace area at 0.4100 support and resistance area.
Trade safe, Joe.

ADA Cardano analysisADA is one of the best crypto in market. Fundamental very strong. Technical strong.

ADA price analysisThe price of ADA has been in a downtrend for approximately 110 days. After the breakout from the trend line and rejection from the resistance zone (Green) now the price is retesting the trend line.
The chart also marks important support and resistance levels. Support levels, where there's strong buying interest, are at $0.3739 - $0.3600 in Yellow. If the price falls below these levels, it might go even lower.
Resistance levels, where there's strong selling pressure, are at $0.4184 - $0.4261 in Green and $0.4907, and the Pink zone at $0.5608 - $0.5728. These levels are crucial because they show where the price struggles to go higher. The trading volume is moderate, which means there's steady activity in the market without big increases or decreases.
If ADA price breaks above the Green zone with strong volume, it could mean a change to an upward trend, targeting higher resistance levels like $0.4907 and zones in Pink and Blue.
If the trend line fails to hold the price it drops below support one in Yellow at $0.3600 - $0.3739, it could continue going down.
