ADA : This May Be Your Last Chance Before Exploding to Upside !!The ADA will increase 40 cents and reach to the top of the wedge in the coming weeks.
Give me some energy !!
✨We spend hours finding potential opportunities and writing useful ideas, we would be happy if you support us.
Best regards CobraVanguard.💚
_ _ _ _ __ _ _ _ _ _ _ _ _ _ _ _ _ _ _ _ _ _ _ _ _ _ _ _ _ _ _ _
✅Thank you, and for more ideas, hit ❤️Like❤️ and 🌟Follow🌟!
⚠️Things can change...
The markets are always changing and even with all these signals, the market changes tend to be strong and fast!!
ADAUSDT.3S trade ideas

ADAUSDT another +100% is at least cooking As we mentioned before and a lot price is near major daily support zones like 0.5$ and 0.6$ and soon these supports will stop price from falling and let it fly and at least we are looking for targets like 1$ once again.
DISCLAIMER: ((trade based on your own decision))
<<press like👍 if you enjoy💚

ADA/USDT | Multi-Month Breakout Brewing — a 10x play ?Cardano is quietly mirroring its previous macro cycle — but this time, the structure looks tighter, cleaner, and potentially more explosive.
The multi-month chart reveals a consistent uptrend forming off the 2022 lows, contained within a well-respected ascending channel. The price action shows strong similarities to the 2018–2020 accumulation phase, followed by the breakout that led ADA to its all-time high in 2021.
The current price structure is forming higher highs and higher lows within a channel — a strong bullish continuation pattern.
Volume has been increasing steadily during the up-moves, signaling real demand building underneath.
Fibonacci Extensions from the previous cycle highs and lows show key long-term resistance zones:
1.618 – $4.91
2.618 – $7.79
4.236 – $12.47
These levels could act as major psychological targets if the trend continues to evolve similarly to the last cycle.
⏳ Current Price (~$0.64) is still significantly below previous all-time highs and long-term extension zones — offering a potentially favorable risk/reward setup for patient investors.
⚠️ As always, nothing moves in a straight line — but if you're a macro-mind investor, you’ll start to notice more straight lines than most. Zooming out often reveals the patterns that noise hides.

Cardano (ADA): 4 Strong Signs of Upcoming DropCardano has had a good rally both to lows and highs but we still see the dominance from sellers, which means we might see further movement to lower zones as long as sellers dominate the 4 points that we told you in the video!
More in-depth info is in the video—enjoy!
Swallow Academy

TradeCityPro | ADA: Watching Support and RSI for the Next Move👋 Welcome to TradeCity Pro!
In this analysis, I want to review the ADA coin for you—one of the most popular and long-standing cryptocurrencies, currently ranked 10th on CoinMarketCap with a market cap of $22 billion.
📅 Daily Time Frame
In the daily time frame, as you can see, after ADA’s previous uptrend, the price moved upward and, after breaking 0.4322, continued its bullish leg up to 1.1325.
✔️ Following this move, the price entered a corrective phase, and during its first pullback, it performed a time-based correction down to 0.8161, but after breaking this area, deeper corrections began.
📰 Coinciding with the news of the creation of a crypto reserve in the U.S., this coin—alongside other coins in that basket—saw another bullish move that once again pushed the price up to 1.1325. However, within a few days, it reversed the entire bullish move and dropped to the 0.5579 zone.
📈 During this correction, we can draw a trendline from the price lows. As you can see, the price has reacted well to this trendline, and the overlap of this line with the 0.5579 zone has created a strong support, causing the price to bounce and show some bullish momentum.
📊 Currently, after bouncing from this zone, the price initially moved up strongly and with high volume. However, over the past few days—especially with the weekend—momentum has decreased, and volume has dropped as well.
📉 If this decline in volume continues, the price won’t be able to rise further, and bearish momentum could gradually return. If the 0.5579 support breaks, the price could continue moving downward.
💥 The downward trendline currently in play could act as a dynamic resistance during the next bullish legs.
🔼 For a bullish move, the key is the RSI divergence. This positive divergence, now visible with three higher lows, could support a bullish reversal. The trigger for this divergence is a break above the 50 level on RSI.
🛒 If RSI stabilizes above this level, bullish momentum will likely enter the market. In that case, breaking the 0.8161 trigger would offer a long entry or spot buy opportunity. The main trigger for price, however, remains the break of 1.1325, which is ADA's key resistance level.
📝 Final Thoughts
This analysis reflects our opinions and is not financial advice.
Share your thoughts in the comments, and don’t forget to share this analysis with your friends! ❤️

Cardano (ADA) - 1DADA has recently broken out of a Falling Wedge pattern, which is a bullish technical pattern. After trading within this pattern for some time, ADA successfully surpassed the resistance level, indicating potential upward momentum. This breakout suggests that buyers are gaining control, and the price may continue to rise in the near term.
targets to watch:
- $0.6652
- $0.8413
- $1.1337

Cardano: Your Altcoin ChoiceOne of our friends asked for an update on Cardano, the 2025 All-Time High. I already did several charts with the ATH so I will recycle this one since the numbers stay the same.
We can still use the same numbers today we extracted after June 2023, that is because we use the bear market bottom to project a new ATH. Anyway, the chart is easy.
Cardano bottomed June 2023 and has been moving within an uptrend, higher highs and higher lows.
The last bullish jump happened in late 2024 peaking in early December. Then the correction comes. The correction bottomed early February 2025 and this week we are seeing the establishment of a higher low. This higher low is a great place to buy and go LONG. Because the correction is over so the next move is up. No more lower prices. No more sideways, no more corrections but up.
The correction lasted some 4 months and amounted to a drop of more than 60%. Some people without a clue are calling for lower but this is impossible. A correction is just that a correction, not a bear market. A bear market was 2022 and it requires lower and lower... Cardano has been going up since June 2023. We are entering the bull-run phase in late 2025. The contrary to a bear market we are actually seeing, we are in a bull market. The recent bearish action is a simple correction of the last bullish move.
Obviously bullish because we have a higher low compared to August 2024, the last bottom. This is super basic but sometimes is good to go back to basics before a major run.
The standard 2025 All-Time High target is $8.11. If the market does really good, it can go higher, much higher. If the market does poorly, growth will still be amazing. Doing poorly is not an option. Crypto is the new default method to exchange value. Soon, 1 billion people will be trading and using Crypto, growth will be something that cannot be explained.
Bet on Crypto and you will win in the short-, mid- to long-term.
Buy and hold Crypto and your financial future is secured, this is an easy bet.
Bet on the future, bet on the Internet.
Bet on technology. Bet on innovation.
The market needs your support.
Fiat currencies are going down after centuries of doing their work.
Nothing against fiat and decaying banks, they played their role.
We have nothing against landline and dial-up, but now we go wireless...
Nothing against the mail but we use e-mail.
Nothing against cash but we use virtual transactions and credit cards.
Thanks a lot for your support.
It is impossible to stop the evolution of the world.
Humanity will continue to improve.
A new form of money is not only necessity but a must.
We welcome Crypto.
We love to pay with our phones.
With Crypto, you can transfer money fast and easy, without censorship, without government control.
Abundance, peace, prosperity and freedom is the new norm.
Namaste.

Trading opportunity for ADAUSDTBased on technical factors there is a Sell position in :
📊 ADAUSDT
🔴 Sell Now
🪫Stop loss 0.7200
🔋Target 0.5000
📏 R/R 1,5
💸RISK : 1%
We hope it is profitable for you ❤️
Please support our activity with your likes👍 and comments📝

ADA road map !!!The ADA will increase 40 cents and reach to the top of the wedge in the coming weeks.
Give me some energy !!
✨We spend hours finding potential opportunities and writing useful ideas, we would be happy if you support us.
Best regards CobraVanguard.💚
_ _ _ _ __ _ _ _ _ _ _ _ _ _ _ _ _ _ _ _ _ _ _ _ _ _ _ _ _ _ _ _
✅Thank you, and for more ideas, hit ❤️Like❤️ and 🌟Follow🌟!
⚠️Things can change...
The markets are always changing and even with all these signals, the market changes tend to be strong and fast!!

AS BEFORE WE LONGED AND GAPED OUR PROFITS ,THIS IS TIME WE SHORTHere is the set up,acc to rsi we are over sold atm its a short clean

ADA breaking a 15 day downtrendMonths of only downtrends and consolidation. We need to make our way higher before Donald The Pumpkin Trump starts talkikg again

ADA Poised for a Bullish Breakout? Key Levels to Watch!🔹 Current Market Structure: #ADA is moving sideways in an accumulation phase on the 1-hour timeframe, indicating potential strength for an upcoming bullish move.
🔹 Bullish Confirmation:
We are closely monitoring a breakout above the resistance level. A confirmed candle close above the accumulation zone with a successful retest would signal a strong buy opportunity.
🔹 Trading Plan:
🔹 Wait for a break and retest above the resistance.
🔹 Enter a long trade with proper risk management.
🔹 Target key resistance zones for potential profits.
🔹 What’s Your Take? Will #ADA break out or get rejected? Drop your thoughts in the comments!
🔹 Like, Comment & Follow for more real-time updates!

cardano bullish momentAfter the the recent price drop on most of the asset classes , i made my analysis and highlighted my key surpport zones where price is likely to respect and switch to an upward trajectory hence gaining a bullish momentum

ADAUSDT → Correction to the liquidity zone before the fall ↓BINANCE:ADAUSDT is in a bear market, under pressure. An exit from consolidation and a pullback with the aim of retesting the resistance (liquidity zone) before further decline is formed
The fundamental background for cryptocurrencies is extremely negative. Bitcoin on yesterday's manipulation related to the 90-day tariff break, which was later denied by the White House began to form “helicopters” and high volatility. As the market calms down, the price returns to the selling zone, which creates pressure for Cardano as well.
Technically, a false breakdown of 0.5 fibo is formed and the price is consolidating near the local support at 0.5800. The breakdown and consolidation of the price below 0.58 will provoke the continuation of the fall. A retest of the previously broken consolidation support at 0.6300 is possible.
Resistance levels: 0.63, 0.6661
Support levels: 0.581, 0.5092, 0.4564
The market structure is exclusively bearish. A False breakout of resistance or breakdown of 0.581 will provoke a further fall, but the level of 0.5092, if broken, will finally drive the coin into the zone of emptiness, which may lead the price to fall to 0.45- 0.42.
Regards R. Linda!

ADA retraces to key Fibonacci level with bullish structureOn the BINANCE:ADAUSDT 1W chart, the price has retraced to the 78.6 Fibonacci level after a strong bullish impulse and is now forming a higher low, keeping the overall market structure intact. The Ichimoku cloud (10, 20, 40, 10) remains far above the current price, confirming there is still bearish pressure in the short term, but this also creates space for a sharp move up if momentum shifts. The Trend Strength Index (20, 10) is deep in oversold territory, signaling weakness, while price action shows early signs of accumulation. The two recent lows have built up liquidity, suggesting a possible sweep before a continuation to the upside. Long positions below 0.52 with a stop under 0.32 and a target near 1.32 offer a favorable risk to reward setup, especially if lower timeframes confirm a shift in direction. This area may represent a key long term opportunity if the bullish scenario plays out.
Disclaimer: This content is for educational and informational purposes only. It does not represent financial advice or a recommendation to buy or sell any financial instrument. Trading involves risk, and you should only trade with money you can afford to lose.

ADAUSDT 0.5$ is strong enough to pump the price As we mentioned before we are looking for long from 0.5$ and now support hit and we can expect range market or rise at least here to our first target which is around 0.75$ to 1$.
DISCLAIMER: ((trade based on your own decision))
<<press like👍 if you enjoy💚

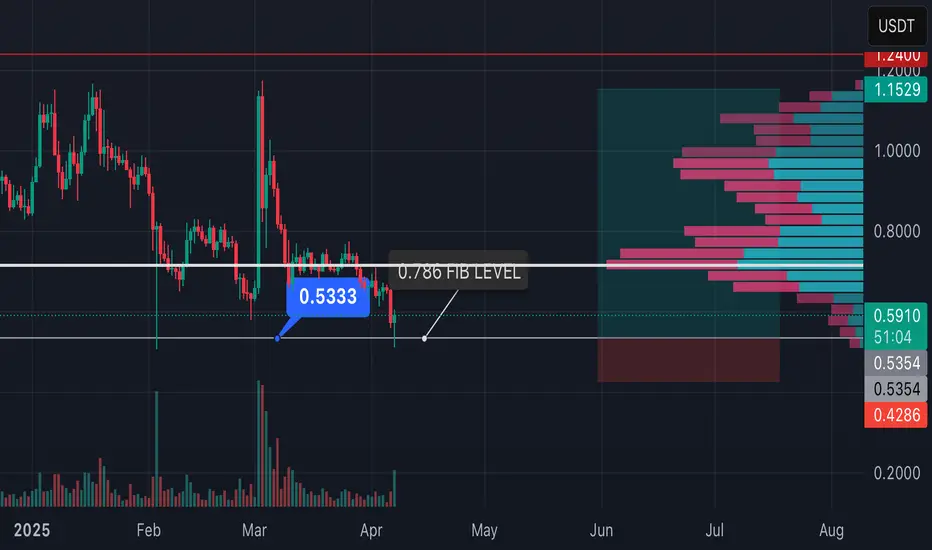
ADA We are going to do another 1XWe have the retracement level of 0.786 on the price of 0.5354 from here we are going to get another one next in a few months hold your positions and don’t be panic.
Cardano (ADA) Long using Lesson 15 MethodologyAlready first target was hit and moved stop loss to BE.
Lesson 15 Methodology:
1. Largest Down wave on support (could have buyers in there)
2. Place AVWAP at the beginning of the down wave
3. Wait for price to cross upwards the AVWAP and pull back to it.
4. Wait for a Plutus long signal where in this case it was a PRL
and up we go!
Now this huge pin with the enormous volume worries me for sellers but since we got 1st target and stop is at BE I will let it run.

ADAUSDT Drops, Bear Pressure on LHHi there,
ADAUSDT appears bearish on the M30 due to lower high pressure. The target is 0.5827, with a bias towards 0.5263. Monitoring will be required.
Happy trading and have a lovely weekend.
K.
Not trading advice.

ADAUSDT NEXT MOVESell after bearish candle stick pattern, buy after bullish candle stick pattern....
Best bullish pattern , engulfing candle or green hammer
Best bearish pattern , engulfing candle or red shooting star
NOTE: IF YOU CAN'T SEE ANY OF TOP PATTERN IN THE ZONE DO NOT ENTER
Stop lost before pattern
R/R %1/%3
Trade in 5 Min Timeframe, use signals for scalping

ADAUSD - ANALYSIS👀 Observation:
Hello, everyone! I hope you're doing well. I’d like to share my analysis of Cardano (ADA-USD) with you.
Looking at the Cardano chart, I expect that if we close the weekly candle above 0.622, the price could increase towards the target of 0.8939. However, if the weekly candle closes below 0.622, I anticipate further price decline with a target of 0.4570.
📉 Expectation:
Bullish Scenario: Weekly close above 0.622 → price moves towards 0.8939.
Bearish Scenario: Weekly close below 0.622 → price declines towards 0.4570.
💡 Key Levels to Watch:
Support: 0.4570
Resistance: 0.622, 0.8939
💬 What do you think about Cardano (ADA-USD) this week? Let me know in the comments!
Trade safe

Cardano (ADA) is on the verge of an 80% surge (1D)Despite all the positive news, it couldn’t maintain its bullish trend, as seasoned whales typically don't enter the market at the end of bullish waves.
The zone we’ve highlighted is where we believe whales will enter Cardano. Due to heavy buying pressure, the price could experience a 50% to 80% surge.
From the point marked with the green arrow on the chart, Cardano’s bullish phase has begun. It appears to be forming an expanding/diagonal/symmetrical triangle.
We are looking for buy/long positions in the green zone, where the hypothetical wave F might come to an end.
Targets are marked on the chart.
A daily candle closing below the invalidation level will invalidate our buy outlook.
For risk management, please don't forget stop loss and capital management
When we reach the first target, save some profit and then change the stop to entry
Comment if you have any questions
Thank You

Bearish pressureADA/USDT – Price Action Analysis
On the 1-hour timeframe, price has been following a clear downtrend, respecting a descending channel structure. After reaching the lower boundary, sellers lost some momentum, and price started to form a rising wedge, typically seen as a bearish continuation pattern in such contexts.
Currently, price is testing a key confluence zone:
The upper boundary of the wedge
The descending trendline resistance
And also sitting below the dynamic resistance of the 200 EMA.
From a price action perspective:
Bullish candles are showing limited strength and upper wicks indicate selling pressure.
A confirmed breakdown below the wedge support could lead to further downside towards the previous demand area around 0.6550 - 0.6340.
