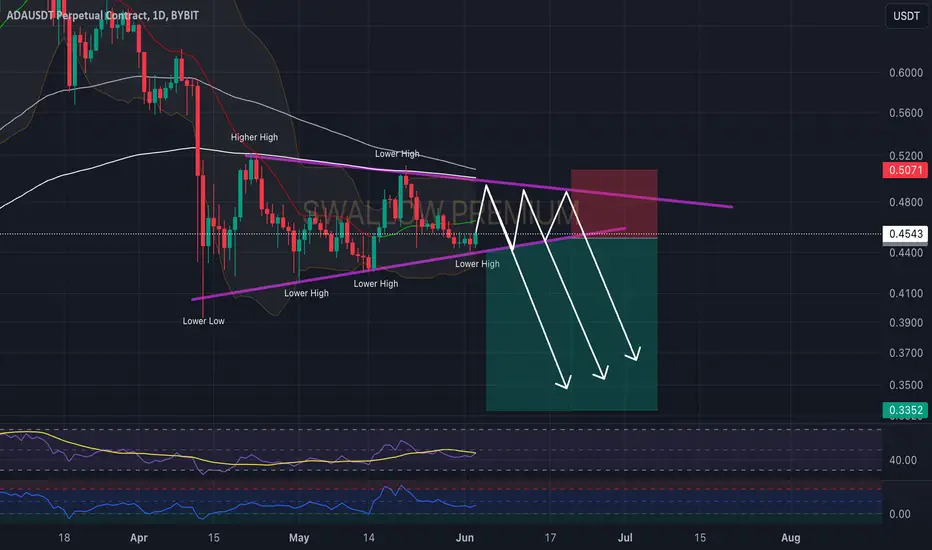
Cardano (ADA): Waiting For Breakdown Of Triangle Formation!Cardano is looking nice, forming a triangle, pressing both the lower and upper sides, and tightening the end gap of the triangle.
We are keeping an eye on the formation and also the EMAs here, which are indicating a potential further drop to happen here.
The reason is simple: We had a nice liquidation on April 12th, and we had some small re-tests (but they were weak), which indicate a potential further drop to happen.
So as long as we hold EMAs and move inside the triangle, we should be good for a possible downward movement here!
Swallow Team
ADAUSDT.3S trade ideas
Candano - nice setup for further rally!Technically Cardano looks very nice to advance the coming months - bottom pattern, RSI divergence, and IMACD support show this rally has lags.
Fundamentally, Cardano's technical advantages and ambitious upgrades could make it a solid pick. You can use Cardano tokens to pay for services and cover fees on its underlying blockchain network, which is designed to support complex transactions in fields such as finance. Unlike the current market leader, Bitcoin, Cardano is programmable. On top of serving as a way to store and transmit value, it also allows users to create self-executing programs called decentralized applications (dApps), which offer services such as asset exchanges and art markets on the network.

Cardano - It is Over Soon (or Not?)Horrible chart - only 1 cent lower is a MUST SELL ALL signal. It's very disappointing, but numbers are numbers.
Chart - negative trends, momentum and Corel Trend clearly confirm
MACD - far in negative trend
RSI - heading south, not oversold yet
iMACD - negative + negative
Better to sit on the fence and not lose anything than continue...
BINANCE:ADAUSDT BINANCE:ADAUSD

POSITION :ADAUSD tim frame 4-hourEducational analysis of ADAUSD currency for buying in the four -hour time frame

Trade Signal: ADAUSDTDirection: Sell
Enter Price: 0.4492
Take Profit: 0.41966667
Stop Loss: 0.48436667
---
Justification:
This trade signal is generated using the EASY Quantum Ai strategy. Our analysis indicates a bearish trend for the ADAUSDT currency pair. Several factors have contributed to this forecast:
1. Technical Indicators: Key technical indicators such as Moving Averages, RSI, and MACD are showing downward momentum, suggesting that the market sentiment is leaning towards selling.
2. Volume Analysis: A recent increase in trading volume during price declines indicates strong selling pressure, which typically precedes a further drop in price.
3. Market Sentiment: Sentiment analysis from major social media platforms and news articles shows a prevailing bearish outlook on ADA, contributing to our decision to initiate a sell position.
4. Fundamental Factors: Recent news and events surrounding ADA and its ecosystem may have contributed to decreased investor confidence, further adding to the selling pressure.
Stay vigilant and make sure to monitor market conditions as they can change rapidly. Always consider your risk management strategies when entering a trade.
Happy trading!
---
Disclaimer: This signal is for informational purposes only and does not constitute financial advice. Please conduct your own research or consult a financial advisor before making any trading decisions.

Trade Signal for ADAUSDT - Direction: BuyEnter Price: 0.4378
Take Profit: 0.45006667
Stop Loss: 0.41996667
Dear Traders,
We have identified a promising buying opportunity for the ADAUSDT currency pair based on recent market analysis and our proprietary strategy, EASY Quantum Ai. Here's the detailed rationale behind this trade signal:
1. Technical Indicators Alignment: Several technical indicators, including moving averages and RSI, are indicating a bullish trend for ADAUSDT. The 50-day moving average is trending upwards, suggesting a buying sentiment in the market.
2. Market Sentiment Analysis: A review of current market sentiment reveals a growing confidence among traders in Cardano (ADA). Recent news and developments in the Cardano ecosystem have contributed to this positive outlook.
3. Volume Analysis: Increased trading volume in ADAUSDT over the past few days supports the potential for an upward movement. This uptick in volume often precedes significant price movements.
4. Support and Resistance Levels: Our analysis has identified a strong support level near 0.41996667, which falls in line with our Stop Loss. Correspondingly, a notable resistance level lies near the Take Profit target of 0.45006667, where historical data suggests possible price inhibition.
5. EASY Quantum Ai Strategy: Utilizing the advanced capabilities of EASY Quantum Ai, our predictive model has indicated a high probability of price appreciation from the Enter Price of 0.4378 to the Take Profit level. This strategy incorporates both historical data and real-time analytics to forecast market movements accurately.
We recommend entering the trade at the specified Enter Price of 0.4378 and setting your Take Profit at 0.45006667. It's crucial to set a Stop Loss at 0.41996667 to mitigate potential risks.
Happy Trading!
Best regards,
Your Trading Team

Long signal for ADA/USDTThis technical analysis is based on the daily chart of BINANCE:ADAUSDT on the Binance exchange. This analysis draws two price channels and evaluates support and resistance levels.
Price Channel Analysis:
The previous bearish channel is broken out, and a bullish channel is formed.
The suggested entry point is around 0.4518 USDT.
Entry and Exit Points:
Entry: 0.4518 USDT
Take Profit: 0.5717 USDT (26.56%)
Stop Loss: 0.4129 USDT (8.61%)
R/R Ratio: 3.08
Conclusion:
This analysis suggests that by adhering to the specified take profit and stop loss levels, a successful trade can be achieved. The Reward/Risk Ratio for this trade is approximately 3.08, indicating a highly favorable risk-to-reward scenario. To manage risk effectively, it is recommended to strictly follow the stop loss level.

ADAUSDT Trading Signal: Buy📈 Direction: Buy
Enter Price: 0.4442
Take Profit: 0.44966667
Stop Loss: 0.43526667
We recommend entering a Buy position on the ADAUSDT currency pair at an entry price of 0.4442. The target for this trade is set at a Take Profit level of 0.44966667, while the Stop Loss is placed at 0.43526667 to manage risk.
Reasoning:
This prediction is based on the application of the EASY Quantum Ai strategy , which integrates multiple factors including market momentum, trend analysis, and volume insights to make an informed call.
1. Market Momentum : Recent market activity demonstrates bullish momentum for ADAUSDT. There has been consistent upward movement and strengthening buyer interest, signaling a potential upward trend continuation.
2. Trend Analysis : Technical analysis indicators show that ADAUSDT is in a favorable position for a Buy. This is confirmed by the moving averages and support levels holding firm around the Enter Price of 0.4442.
3. Volume Insights : There has been a noticeable increase in trading volume for ADAUSDT, which often precedes or accompanies significant price movements. This aligns with a bullish outlook.
As with all trades, please monitor the market closely and adjust your strategy as needed. Trading carries risk, and it is crucial to be prepared for any market fluctuations.
Happy Trading! 📈


Lingrid | ADAUSDT byuing OPPORTUNUTY at LOWER pricesThe price perfectly fulfilled my previous idea. It bounced off the resistance zone. BINANCE:ADAUSDT plummeted downwards, shattering support levels in its wake. Failing to break and close below the crucial 0.50 level, was merely a precursor to a more significant correction, which has recently unfolded. I believe the market may now be poised to revisit its recent support levels and channel boundary, potentially offering a chance to re-enter the market at more attractive prices. On the daily timeframe, the market remains within a developing range zone, which is taking shape as a triangle pattern. In my opinion, this presents a compelling opportunity to capitalize on lower prices by buying into the market. My goal is the resistance zone 0.4700
Traders, if you liked this idea or if you have your own opinion about it, write in the comments. I will be glad 👩💻

Honestly, I don't feel like explaining, the chart says it all !!Hi.
BINANCE:ADAUSDT
After the fifth bullish wave, Cardano has completed his corrective waves (ABC) and now he has reached the end of the wedge, now it is time to start the five bullish waves .
✅ Due to the Ascending structure of the chart...
🟢 High potential areas are clear in the chart.
🟢 Bullish Wedge.
🟢 Starting 5th waves.
✨Targets are:
🎯$0.52
🎯$0.57
🎯$0.62
🎯$0.685
🎯$0.73
🎯$0.775
❗ Note that if the WEDGE is broken down with the power of descending candles, our analysis will fail.
Stay awesome my friends.
_ _ _ _ _ _ _ _ _ _ _ _ _ _ _ _ _ _ _ _ _ _ _ _ _ _ _ _ _ _ _ _ _
✅Thank you, and for more ideas, hit ❤️Like❤️ and 🌟Follow🌟!
⚠️Things can change...
The markets are always changing and even with all these signals, the market changes tend to be strong and fast!!

Long Opportunity for ADA CardonaMarket Status: Consolidation for short term (monthly), uptrend for long term(yearly)
Its fair that the price and the open interest of ADA has dropped approximately 60% which is the same level of January 2024. Therefore a retracement is highly possible to the middle point of consolidation box. The trades will proceed in inverse perpetual which 30% of total fund will deploy and 2x leverage will be use.
Risk Alert: this trade is risker than the previous ETH trade, if the price remains in consolidation status by the end of this month, this position will be close. In contrast, if the price back to the middle level, 70% of the position will be taken profit. And all the taken ADA profit will be hold until the end of 2025.

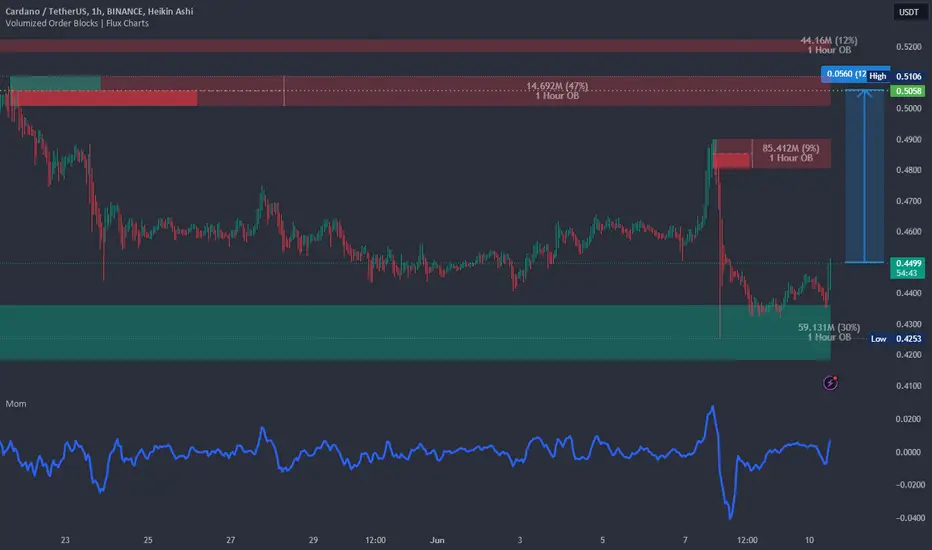
#ADAUSDT on bullCardano's ADA token has recently reached a crucial support level around $0.42 - $0.433, which has historically been a significant zone for price stability. This area appears to have attracted substantial liquidity, indicating potential buying interest from investors who view this level as a favorable entry point. The increased liquidity suggests that market participants are actively accumulating ADA, possibly anticipating a price rebound. As Cardano continues to develop its blockchain technology and expand its ecosystem, this support level could serve as a strong foundation for future growth

Possible test and accumulation at the supportCardano has dropped to the support area of $0.42 - $0.43 and collected liquidity. We might see a test of the support area and some accumulation. This is a good time to monitor ADA around this support area. The resistance zone is at $0.49 - $0.50.

ADAUSDT is BullishADA has given a breakout from the declining phase after bullish RSI divergence appeared on 1H time frame, following which the price printed a higher high followed by a higher low, signaling that bulls are trying to take control of the price action. If previous higher high is broken successfully we can expect a bullish rally. Targets are mentioned on the chart.
