DXY trade ideas
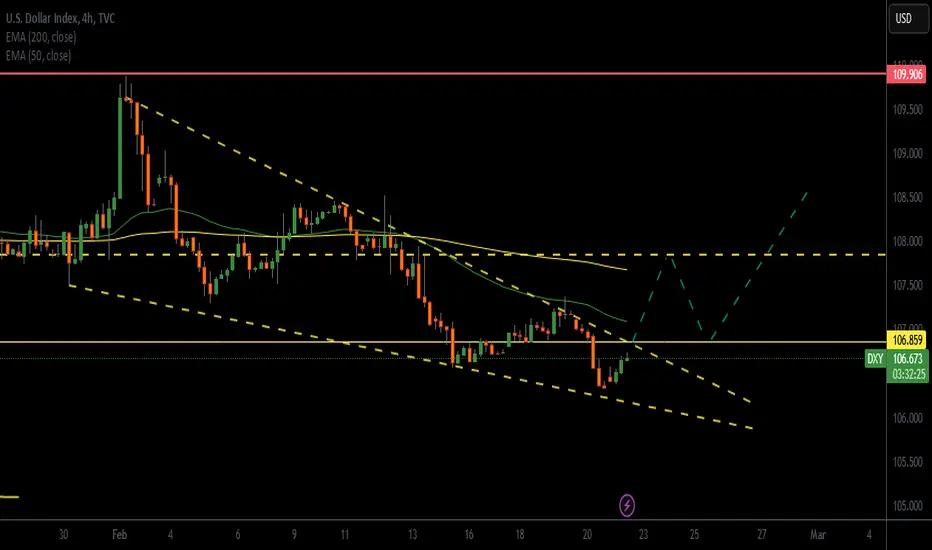
correctionThe upward and fluctuating trend is expected to continue until the specified resistance levels, then a trend change will occur and we will witness the beginning of the downward trend.
The downward trend is expected to continue until the red support area.

Short swing trade set up developingI can see a good short trade opportunity developing.
1)The price sharply dropped below the major support/resistance zone around 107 area and retraced up gently within the ascending parallel channel to fill the fair value gap.
2)The current 4H candle is moving below the bottom parallel channel. (developing)
3) MACD is in the bear zone and it looks like it is about to cross to the downside (but not confirmed).
4) RSI is also in the bear zone and it is starting to cross to the downside.

MIGHTY DOLLAR - Is on the bearish side no signs of reversals From Weekly all the way to the 4 hour time frames we are seeing nothing but bearish structure. We have hit a major support area. I will be looking for price to continue its bullish trend.

DXY More downside? DXY still looks strongly bearish. Expect it to return to 107.000 and continue downside movement.
Target next low at 105.420.
_______________________________TIMEFRAME : H4
ath_trades

DEMAND SET UP .. dxy.. the inverse of eurusd. gbpusd. etc..we Bullish NOW, WE NEED PRICE BACK TO THis demand area on h1.. then we buy ..
when dxy is back up, eurusd returns bearish

Is it time to buy the US dollar?With US inflation rising, the US economy performing well, and rates higher for longer (well, I wouldn't be surprised to see the Fed hike rates by the end of 2025), the USD continues to be an obvious buy.
The TVC:DXY is currently testing key horizontal support (previously resistance) and is nearing the weekly moving averages. This could be the time to buy the dollar.
I'm personally looking to short OANDA:EURUSD OANDA:GBPUSD and OANDA:NZDUSD and buy OANDA:USDCAD and OANDA:USDCHF

DXYShort idea. From last supple that broke structure. In line with weaker fundamental data and stronger Euro. Waiting for confirmation from these to levels. More confident with the higher supply zone. Would correlate with key demand zone for EU.

DXY - Bearish.Similar thesis to my NASDAQ analysis, with the DXY in a current bear trend, with key levels unmitigated below, and very close to current price action. Overall, expecting a decline in the price of the DXY over the next weeks sessions, mainly to hunt liquidity below to then continue the monthly Bullish bias and trend.
Align it with the current US economic proceedings, and a declining dollar makes sense for a few more weeks until thing calm down with tariffs etc. etc.
Expecting assets with a positive correlation to the dollar to also correlate any bearish moves in the DXY, with inverse assets such as gold benefitting.
Mahalo.

Trade Idea for U.S. Dollar Index (DXY) – Feb 19, 2025📌 Current Market Context
DXY is trading at 107.023 , slightly above the 61.8% Fibonacci retracement level (106.344).
This level is a key golden ratio support, where strong reversals often happen.
The uptrend from Sept 2024 suggests that bulls are still in control unless this retracement turns into a full reversal.
📈 Bullish Trade Idea (Buy Setup)
✅ Entry: Look for bullish price action (rejection wicks, engulfing candles, or a strong bounce) near 106.344 - 106.500 .
🎯 Targets:
Target 1 : 108.035 (78.6% Fib)
Target 2 : 110.189 (previous high)
📍 Stop-Loss: Below 105.800 (just under 61.8% retracement to avoid stop hunts).
📊 Risk/Reward: ~1:2 or better.
📉 Bearish Trade Idea (Sell Setup)
❌ Trigger: If DXY closes below 106.344 on a daily candle , it could signal further downside.
📉 Entry: Sell below 106.200 after confirmation.
🎯 Targets:
Target 1 : 105.156 (50% Fib)
Target 2 : 103.968 (38.2% Fib)
📍 Stop-Loss: Above 107.000 (to avoid fakeouts).
📊 Risk/Reward: 1:2 minimum.
🛠️ Risk Management Notes
Watch for fundamental news (FOMC, inflation data, rate decisions) that could cause volatility.
Use partial take profits to secure gains along the way.
If entering a buy trade, consider trailing stops once price reaches 108.035.

DXY short idea dxy has been bearish
price broke out of a strong area of support around the 107.480 region
we could anticipate a retest of 107.480 to go lower
or if price decides to respect current price of 107.070 which is aligned with H4 structure looking left, we could see her falling from that specific price

DXY short setup📉 USD Dollar Index (DXY) Short Setup 📉
Entry: Around $107.00
Stop Loss: $107.50 (Above resistance level)
Target: $106.00 (Support zone)
Risk-Reward Ratio: ~2.0
🔹 Potential breakdown of ascending trendline 📉
🔹 EMA alignment showing weakness 🔻
🔹 Rejection near key resistance level 🔴
Looking for confirmation for entry. Let me know your thoughts! 💬 #DXY #USDollar #Forex #Trading

#USDX 4HUSDX (4H Timeframe) Analysis
Market Structure:
The price is forming a flag pattern, which is generally considered a continuation signal. This indicates that the market is in a consolidation phase after a strong move, and a breakout could lead to further bullish momentum.
Forecast:
A buy opportunity may arise if the price breaks above the upper trendline of the flag pattern, confirming bullish strength.
Key Levels to Watch:
- Entry Zone: A buy position can be considered after a breakout above the flag pattern with strong volume.
- Risk Management:
- Stop Loss: Placed below the recent low to manage risk.
- Take Profit: Target the next key resistance levels based on previous price action.
Market Sentiment:
The flag pattern suggests that the market is pausing before continuing its upward move. Waiting for a confirmed breakout will help align with the prevailing trend and avoid false signals.

$DXY, $BTC, $XRP, Theory The TVC:DXY is in a spiralling downtrend which will cause CRYPTOCAP:BTC to pass its current ATH eventually topping again which will correlate with the TVC:DXY finding strong support between 103.6 and 104. The TVC:DXY will probably set a local range before eventually continuing on a bullish trajectory back toward 110+ ( *this will mark the end of the first half of the bull market * from Now - May)
Some event in May will cause the TVC:DXY rebound to 110+ during which time we will see a major market crash lasting from (May to July). However: From 110+ i suspect the TVC:DXY will see another major correction downward which will mark the final phase of the bullrun begining about June/July until only God knows when, but historical indicators point to around October/Nov for the top.
Unless CRYPTOCAP:BTC completely crashes on one of its famous bloody corrections and go to ZERO then, it MUST go above $200,000 This cycle.
Remember CRYPTOCAP:BTC floats all boats , so just imagine what price CRYPTOCAP:XRP and the broader digital currency market will be... gimmi your best guess!


Long time Sell!Hello all. DXY is on down trend and will go bellow 100. but it needs correction to go lower. today probably the first correction will happen, because market break the Important Low Structure. This idea will update Step-by-Step (wink)

USDX, DXYUSDX price is approaching the support zone of 106.45-105.36. If the price fails to break through the main support zone of 105.36, it is expected that there is a chance that the price will rebound. On the contrary, if the price can break through the level of 105.36, it will have a negative impact on the dollar.
🔥Trading futures, forex, CFDs and stocks carries a risk of loss.
Please consider carefully whether such trading is suitable for you.
>>GooD Luck 😊
❤️ Like and subscribe to never miss a new idea!

DXYThe DXY (U.S. Dollar Index) measures the strength of the U.S. dollar against a basket of six major currencies: the euro, Japanese yen, British pound, Canadian dollar, Swedish krona, and Swiss franc. It serves as a key indicator of the dollar’s value in global markets. The index tends to rise when the dollar strengthens and falls when it weakens. Major economic events, Federal Reserve policies, inflation data, and geopolitical developments significantly impact its movements. Traders and investors use the DXY to assess currency trends, hedge risks, and make informed decisions in forex and commodities markets.

DeGRAM | DXY retest of the trend lineDXY is in a descending channel between trend lines.
The price is moving from the lower boundary of the channel and has already reached the dynamic support, which has previously acted as a rebound point twice.
The chart dropped below the 62% retracement level and afterwards formed a harmonic pattern and even though the descending structure has been maintained, the index has not yet formed a descending bottom.
We expect that after consolidation above 107.760 DXY may rise in the channel to the nearest resistance at 108.540.
-------------------
Share your opinion in the comments and support the idea with like. Thanks for your support!

DXY- Trade Plan 11/02/2025Dear Traders,
I expect price will be start correction to 105.200 Area ,
Now price started downward movement (Descending Channel)
i have 2 Scenario`s for Correction
1- Start correction from 108.600-108.700
2- Start Correction from 109.000-.109.100
If you enjoyed this forecast, please show your support with a like and comment. Your feedback is what drives me to keep creating valuable content."
Regards,
Alireza!

US Dollar 2025 "Crash" The DXY (USD Index) has exhibited remarkable strength over the past few years, generating significant market volatility as it surges and retraces.
The dollar’s inverse relationship with global markets—when measured against USD—is undeniable. On a broader time frame, we can clearly identify inverse correlations between stock market troughs and peaks seen in the dollar.
Presently, I believe the dollar has completed a substantial rally reaching a peak at the 0.618 retracement level of the 2022 uptrend, just above 109. This level has now prompted a rejection.
When I observe this type of price action, I immediately consider the potential for a corrective 1-to 1 move downward. In essence, this suggests that the second leg of the decline may mirror the magnitude of the initial wave, forming an equal-length corrective move.
By utilizing the trend-based Fibonacci extension, we can identify a projected local low around 95, with this timeframe aligning with November 2025. Interestingly, historical data suggests that bull markets frequently reach their peaks toward the end of the year, often around November or December.
Should this correction materialize, it would likely serve as a highly bullish catalyst for broader markets—potentially fuelling one last major rally before a more pronounced pullback.

DXY bearish pressureThe dollar index is slightly defensive. The result is a break of the ascending trend line. For now, the dollar is supported by the EMA 50 moving average. If the index falls below the moving average line, the index would retreat below 107.00. A potential target is 106.00 on the EMA200 daily moving average.

Weekly FOREX Forecast Feb 17-21This is an outlook for the week of Feb 17-21st.
In this video, we will analyze the following FX markets:
USD Index
EURUSD
GBPUSD
AUDUSD
NZDUSD
CAD, USDCAD
CHF, USDCHF
JPY, USDJPY
The USD Index ran the previous weekly low Friday, capping off another bearish week. With the USD weakening on mixed fundamental news, its currency counterparts are taking advantage of the opportunity to outperform the USD.
Look for the majors to potentially move higher vs the USD this week.
Be mindful there is a lot of red folder news items coming up for the week ahead, to include FOMC on Wednesday.
Enjoy!
May profits be upon you.
Leave any questions or comments in the comment section.
I appreciate any feedback from my viewers!
Like and/or subscribe if you want more accurate analysis.
Thank you so much!
Disclaimer:
I do not provide personal investment advice and I am not a qualified licensed investment advisor.
All information found here, including any ideas, opinions, views, predictions, forecasts, commentaries, suggestions, expressed or implied herein, are for informational, entertainment or educational purposes only and should not be construed as personal investment advice. While the information provided is believed to be accurate, it may include errors or inaccuracies.
I will not and cannot be held liable for any actions you take as a result of anything you read here.
Conduct your own due diligence, or consult a licensed financial advisor or broker before making any and all investment decisions. Any investments, trades, speculations, or decisions made on the basis of any information found on this channel, expressed or implied herein, are committed at your own risk, financial or otherwise.
