Dollar is Wolf pattern is it true I want to share with friends Dollar is Wolf pattern is it true I want to share with friends
DXY trade ideas

Elliott Wave Insight: DXY Correction to 100 ?PEPPERSTONE:USDX TVC:DXY TVC:DXY CAPITALCOM:DXY
📊 DXY Analysis with Elliott Waves 🌊
Wave (B) appears to be completing around 109.
A corrective decline toward the 100 zone (Wave (C)) is likely.
Key Fibonacci targets: 100% at 95.06 and 127.2% at 90.93.
🔎 Keep an eye on price action near these levels for potential reversals.
⚠️ Disclaimer : This analysis is not financial advice. Always conduct your own research before investing.

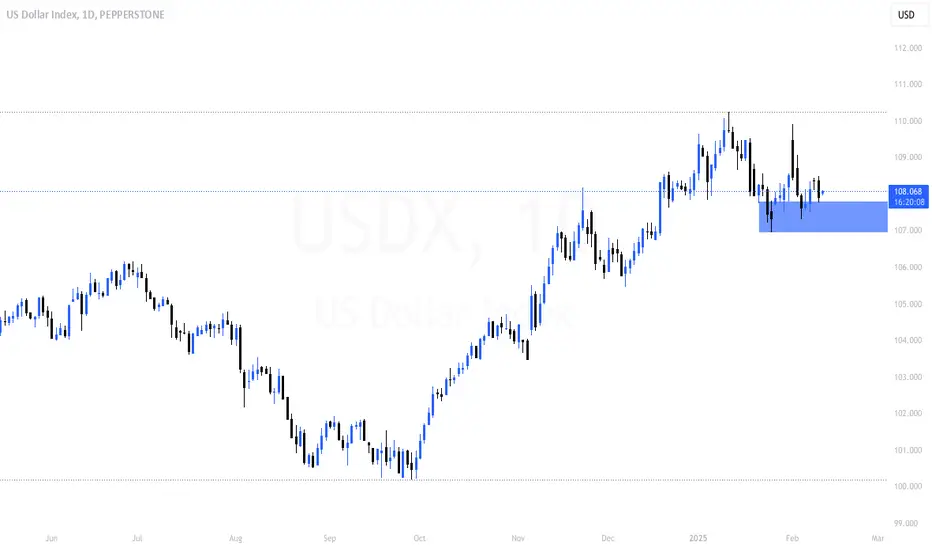
Scenario on DXY 13.2.2025I would see the dollar index like this if I was considering going short I would first consider going above the monthly level of 108.048 if the market continued then I have one more SFP at a price around 108.6 if I was going to talk about a long position then first around the monthly level of 107.053 then the next one below the daily level of 106.724.

Are we going to 103?TVC:DXY CAPITALCOM:DXY
The uptrend was broken at a strong resistance with a retest of the trend and resistance, I think the price will go down, also we have a gap at 103 which I think will close soon .
waiting ...

DeGRAM | DXY growth in the channelThe DXY is in an ascending channel between the trend lines.
The price is moving from the lower boundary of the channel and dynamic support, which has already acted as a rebound point twice.
The chart has formed a harmonic pattern.
The index will continue to grow after consolidation above the 62% retracement level.
-------------------
Share your opinion in the comments and support the idea with like. Thanks for your support!

Levels discussed on Livestream 10th Feb 202510th Feb 2025
DXY: Could trade down to 108 (or consolidate here) before climbing higher to 108.90 or 109 (61.8%).
NZDUSD: Sell 0.5620 SL 20 TP 70 (hesitation at 0.5580)
AUDUSD: In abit of a range, look for test and reaction at 0.6363 resistance level.
GBPUSD: Sell 1.2350 SL 30 TP 85 (watch the trendline)
EURUSD: Sell 1.0290 SL 25 TP 65
USDJPY: Buy 152.40 SL 40 TP 80
EURJPY: Sell 156.25 SL 40 TP 80
GBPJPY: Buy 189.70 SL 60 TP 200
USDCHF: Do nothing, middle of S/R
USDCAD: Buy 1.44 SL 30 TP 60
XAUUSD: Retracing now, needs to stay above 2870, could trade up to 2910

ABC Correction perfection A Beautiful ABC pattern
Lines up perfectly with :
- Previous range Point Of Control
- Previous month Value Area Low
- A Daily Naked
- The 1 to 1
- Global Swing Low Avwap
Elliot wave theory
I expect early next week being hit. Then target the highs for a wyckoff distribution pattern.
People are already positioning EU swing longs, without a spring.
We need to punish dem early bulls 🏌️♀️
CAPITALCOM:DXY OANDA:EURUSD CME:6E1! ICEUS:DX1!

Daily CLS, Order Block Midpoint, Model 1Daily CLS, Order Block Midpoint, Model 1.
At the moment price action is still bullish. I would like to see a reaction on the levels below. If we lose these levels then HTF reversal is in play.
Don't hesitate to comment with your thoughts and share your charts or questions below, I like any constructive discussion.
What is CLS?
is the smart money of all markets. This company aggregates capital from the biggest investment banks and central banks. Its daily volume is over 6.5 trillion.
CLS operates in specific modes and times. By understanding their models, we get an unfair advantage against others with fantastic precision for your entries and mechanical definition of the targets.
Follow me and pay attention to my model 1 and 2.
It's the key to the markets.
None of the strategies of the world has a 100%-win rate and I'm just a human. We make big profits, but sometimes we can miss something or make mistakes.
Good luck and I hope this educational post helps you to become a better trader
“Adapt what is useful, reject what is useless, and add what is specifically your own.”
Dave Hunter ⚔

US Dollar Currently the price is in a consolidation where we have sellers dominating. The participants are price takers and we need more buyers to continue and so we need more demand. to make the market there must give the opportunity to people to come and buy therefore come to the level of the price takeoff in a demand zone of January 27 and there people can buy to create a new high
Highlights of J.Powell's monetary policy testimony1. Interest rate outlook: Reiterating that there is no need to rush to adjust interest rates. If the economy remains strong and inflation does not get close to 2%, policy can remain prudent for longer. If the labor market weakens unexpectedly or inflation falls more than expected, policy could be loosened modestly.
2. Inflation situation: Long-term inflation expectations appear solid. Inflation is close to the 2% target, but still a bit high. Focus on achieving your dual goals. The Fed's framework review will not focus on inflation targeting.
3. Labor market: Unemployment rate remains low and stable. The labor market situation has cooled after the previous overheating period and remains solid, not becoming a source of inflationary pressure. The labor market situation in general remains balanced.
4. Banking supervision: Commit to adjusting banking supervision activities, avoiding creating excessive burdens for banks. It is necessary to reconsider the "non-bank" issue. Committed to the ultimate goal of completing Basel III.
5. Long-term interest rates: The Federal Reserve cannot control long-term interest rates, and the reason long-term interest rates are high has nothing to do with Federal Reserve policy. Long-term interest rates are determined by supply and demand in the bond market.
6. Tariff issue: I still maintain my previous view that countries implementing free trade will have faster economic growth. The Federal Reserve declined to comment on the Trump administration's tariff policy.
7. Housing issues: Fannie Mae and Freddie Mac may lower mortgage rates. Even as interest rates fall, the housing shortage continues. It is unclear whether interest rate cuts will lead to a reduction in housing inflation.
8. Other highlights: If the Consumer Financial Protection Bureau (CFPB) is shut down, there will be a gap in consumer compliance protections. There is no possibility of launching a central bank digital currency.

DXY ProjectionCorrection into the 4h swing low should reject and target previous day low. From there it should reject and target previous day high during CPI

#DXY 1DAYDXY (1D Timeframe) Analysis
Market Structure:
The price has broken below the uptrend support, signaling a potential shift from bullish to bearish momentum. This breakdown indicates that buyers were unable to sustain the upward trend, leading to increased selling pressure. Additionally, a sell engulfing candlestick has formed, further confirming bearish sentiment.
Forecast:
A sell opportunity is expected as the breakdown of uptrend support and the sell engulfing pattern suggest further downside movement.
Key Levels to Watch:
- Entry Zone: After a confirmed breakdown and possible retest of the broken support as resistance.
- Risk Management:
- Stop Loss: Placed above the broken support or recent swing high.
- Take Profit: Target lower support zones for potential downside movement.
Market Sentiment:
The combination of the uptrend support breakdown and a sell engulfing pattern indicates that bearish momentum is increasing. Waiting for confirmation of continued selling pressure will help align with the prevailing market trend.


Dollar Index Bullish to $111.350 (UPDATE)The Dollar bulls have started this week bullish, alongside Gold. Both markets currently are moving with a positive correlation, which don't happen very often.
We are still within our 'Wave 5' bullish move & we expect this move to carry on towards $111.350✈️

DXY going to the sky DXY is preparing to shoot to the moon already because its above the support zone we are waiting for confirmation on Tuesday signal entries will be shared with my students

DXY Will Go Up From Support! Long!
Please, check our technical outlook for DXY.
Time Frame: 9h
Current Trend: Bullish
Sentiment: Oversold (based on 7-period RSI)
Forecast: Bullish
The market is approaching a key horizontal level 106.618.
Considering the today's price action, probabilities will be high to see a movement to 107.382.
P.S
The term oversold refers to a condition where an asset has traded lower in price and has the potential for a price bounce.
Overbought refers to market scenarios where the instrument is traded considerably higher than its fair value. Overvaluation is caused by market sentiments when there is positive news.
Like and subscribe and comment my ideas if you enjoy them!

U.S. Dollar IndexU.S. Dollar Index - Daily
Dear traders,
I sincerely apologize for my absence during this time; I have lost my father, who has passed away. I have not been well over the past two weeks, and I regret not being able to provide an analysis.
DXY Chart Update
I have updated the DXY chart and present it to you now. We know that in smart money analysis, it shows us the primary market trend structure, and by mapping the daily structure, it indicates that this chart is in an upward trend. Currently, we are looking for suitable areas to buy the dollar.
Confirmation of Major High and Market Movements
After confirming the major high with the price reaching the first standard pullback, which I indicated on the chart with IDM, and ultimately reaching the Decisional Order Block, we experienced a good upward move together with a proper buy. However, unfortunately, our major high was not broken, and the market pursued a downward phase towards the IFC Candles.
Current Status and Key Levels
Now, at the beginning of this week, with the price reaching this important IFC block and receiving confirmation in the 4-hour timeframe, we can set our target at the important resistance level of 109.533, which I have designated as my first target. Additionally, there is a 4-hour resistance at the price of 107.182 that should be closely monitored.
Based on this dollar chart, this week we can look to sell euros, pounds, Australian dollars, and New Zealand dollars while buying Japanese yen, Canadian dollars, and Swiss francs. However, it is essential that we also examine other charts and find entry points on those charts as well. My focus this week is on buying the dollar and selling other currencies. I will be updating the entry points for the other charts today and sharing them in my channel.
Fundamental News
In his latest speech, Jerome Powell, the Chairman of the Federal Reserve, emphasized the continuation of contractionary policies to control inflation and mentioned the ongoing strengthening of the dollar. He highlighted positive signs in the U.S. economic growth, which increases the likelihood of a rise in the dollar's value this week.
Source: Jerome Powell's speech at the Federal Reserve meeting, February 2025.
Wishing you all success!
Fereydoon Bahrami
A retail trader in the Wall Street Trading Center (Forex)
Risk Disclosure:
Trading in the Forex market is risky due to high price volatility. This analysis is solely my personal opinion and should not be considered financial advice. Please do your own research. You are responsible for any profits or losses resulting from this analysis.

DXY. Attempt to change the trendHey traders and investors!
In a recent analysis of the AUDUSD currency pair (available in related posts), I mentioned a high probability of a reversal forming on the weekly timeframe. This conclusion was also supported by the situation on the daily timeframe. Currently, a similar situation is observed with the US Dollar Index.
This review illustrates the relationship between different timeframes, aiding in making better decisions in asset analysis and entry point identification.
1D Timeframe
The US Dollar Index (DXY) is in a downtrend on the daily timeframe after breaking down from a consolidation range. The boundaries of this range are marked by black lines on the chart. A key level protecting the breakout from the range is 106.957, which marks the beginning of the last seller's impulse.
At the start of this impulse, a seller's zone formed (red rectangle on the chart). At the end of the impulse, there was a buyer's bar with increased volume, indicating buyer interest at these price levels. The volume in this bar is concentrated in its upper part (blue line on the chart), suggesting potential seller interest.
Key Levels on 1D Timeframe:
Key resistance (start of the last seller's impulse): 106.957
50% of the last impulse: 106.435
Last impulse low: 105.913
Trading Recommendations:
Selling:
Look for selling patterns near resistance levels, especially around 106.957.
Buying:
Currently, there are no conditions for buying (bearish trend). Buyers need to consolidate above 106.957 to change market dynamics and create opportunities for buying patterns.
Now let's analyze a higher timeframe to understand potential downward targets and obstacles. In my opinion, the 11-day timeframe shows the situation best.
11D Timeframe
On the 11-day timeframe, the price is moving within a sideways range, with the upper boundary at 106.952 (close to the daily level of 106.957) and the lower boundary at 99.099.
The last realized vector in the range is a buyer's impulse 7-8. The key bar of this impulse (highest volume) is located in its middle (marked as KC on the chart).
The price broke above the upper boundary of the range during this impulse. However, the seller returned the price into the range, forming a seller's zone above the upper boundary (red rectangle on the chart). This seller's zone corresponds to the daily range.
All of this appears as manipulation (false breakout) of the upper boundary of the range. The current seller's vector is 8-9, with a potential target of 99.807 (99.099).
Obstacles for sellers include the key bar of the buyer's impulse, inside of which is the 50% retracement of the last impulse. I expect the first buyer reaction (long bar on the 11D timeframe) after the price declines to the range of 105.112 - 104.843.
Thus, the 11-day timeframe supports the conclusion on the daily timeframe about the advisability of searching for short positions. Similarly, one can analyze a smaller timeframe, for example, the hourly, to look for short entry patterns.
Key Levels on 11D Timeframe:
Upper boundary of the range: 106.952
50% of the last buyer's impulse: 104.843
First target for selling (PT Short): 99.807
Lower boundary of the range: 99.099
I wish you profitable trades!

Viper Sunday Weekly Forecast Taking a look into the week ahead and what we can expect with news events. How will they effect the markets and what general direction or trade setups we can hope for this week.
Breaking down DXY, US30, Nas100, Gold, Oil, Forex pairs.

DXY - Fed’s Rate Cut Gamble Clashes With ECB Hawkish HoldSuccessful delivery this week with daily sell stops taken out @ 106.566 as expected. This caused risk on conditions for FX pairs; GBPUSD and EURUSD.
The heaviness to the downside indicates continuation to the downside.
106.111 - 105.440 is a price region i am scoping

DXY at a Deciding PointThe DXY has a slight bounce from the fib 0.786 golden pocket, but also at a neutral level of 107.158. I have plotted a trend channel from the higher timeframe which is marked by the dotted line.
At this point, I would take a wait-and-see approach in the coming weeks until a clear direction takes place.

$DXY IdeaFor the DXY, we have an initial outlook of seeking internal liquidity in the discounted region of the monthly range, further reinforcing our bearish trend. Additionally, the presence of a **bottom SMT** in bonds, within a **bullish PDA**, suggests an upward movement for them.
