NAS100 Analysis: Seeking Liquidity & Sell Opportunity🚨 NAS100 Analysis: Seeking Liquidity & Sell Opportunity 🚨
🔍 Current Condition: NAS100 is in a liquidity-seeking phase. Price is likely targeting areas with accumulated stops and orders, ready to sweep them.
📈 Sell Zone: The premium area would be the best place to look for a sell opportunity, typically when price is higher in the range, offering better risk-to-reward setups.
💡 Price Action: Look for rejection signs (candlestick patterns, order blocks, etc.) around the premium zone for confirmation.
📊 Strategy:
Wait for price to reach a premium
Observe for rejection (like a pin bar or engulfing candle) to confirm the sell.
Set Stop Loss slightly above the premium zone and target lower levels where liquidity is likely to be absorbed.
⚡ Conclusion: NAS100 often reverses around premium levels when seeking liquidity. Timing is key, so stay patient and wait for confirmation before executing.
Is this what you had in mind for your setup? Let me know if you want to dive deeper into the analysis! 😊
NAS100 trade ideas

Possible SELLSThe market is currently looking very bearish at the moment. What i would be looking for today is sells based on the current market conditions. There is a FVG on the 2H time frame which i would be looking to enter. Reason for this is because there is liquidity sitting above and i want it to be taken out first before we enter. This will be a form of manipulation to the upside causing most people to buy. TP is 4 Feb 2025 low.

NASDAQ has developped Rising wedge on 1 day time frame US Tech 100 CFD (NASDAQ) – Weekly Chart Analysis (Feb 25, 2025)
1. Market Structure & Trend Analysis
The chart shows a clear uptrend but with a recent rising wedge breakdown, which is typically a bearish reversal pattern.
A strong rejection from all-time highs (~22,000) suggests that sellers are stepping in.
Key downside target: The chart highlights a possible 15-16% drop towards the 18,000-19,000 demand zone, marked in purple.
This area aligns with previous consolidation and strong support from mid-2023.
2. RSI & Momentum Analysis
The RSI (Relative Strength Index) is at 54, showing neutral momentum but trending downward, indicating potential weakening of bullish strength.
If RSI drops below 50, it could confirm further downside pressure.
3. Key Levels to Watch
Resistance:
22,000 - 22,200 (Recent highs and breakout failure)
21,700 - 21,800 (Minor resistance before further downside)
Support:
19,000 - 18,500 (First major support level, previous demand zone)
17,500 - 18,000 (Stronger structural support if decline accelerates)
4. Potential Trade Scenarios
📉 Bearish Scenario (Primary Setup)
If price fails to reclaim 21,700-22,000, the breakdown is confirmed, leading to a short opportunity with targets at 19,000 - 18,500.
Stop-loss: Above 22,000 (Invalidation of breakdown).
📈 Bullish Rebound (Less Likely)
If the index finds support around 19,000 and shows strong buying reaction, it could trigger a long opportunity back towards 21,500 - 22,000.
Confirmation: RSI bouncing from oversold levels & strong reversal candle.
5. Conclusion & Strategy
Bearish bias in the short term due to wedge breakdown.
Watching 19,000 - 18,500 for potential reversal or continuation lower.
Short-term traders: Look for confirmation before entering trades.

Nasdaq market analysis: 25-Feb-2025Let’s dive into today's Nasdaq market analysis. Share insights, and potentially spot opportunities for good pips.

Nasdaq-100 Wave Analysis – 24 February 2025
- Nasdaq-100 falling inside sideways price range
- Likely to reach support level 20820.00
Nasdaq-100 index recently reversed from the resistance level 22190.00 (the upper border of the sideways price range inside which the index moved from December) intersecting with the upper daily Bollinger Band.
The downward reversal from the resistance level 22190.00 started the active short-term correction ii.
The Nasdaq-100 index can be expected to fall further to the next support level 20820.00 (which has been reversing the price from December).

NAS100 Waiting For Buy On 4hr TimeframeMonthly & weekly trending the the same direction.
The price is currently at daily support at 21456.8 (Short term support)
Next target will be weekly support at 20280.7 (Meduim term support)
Final target will be monthly support at 16462.5 (Long term support)

NAS100 short positionprice swept an insane amount of liquidity trendline and reversed agressivelly to the downside
im confident in taking a 2% trade here

Trade idea 24 Feb 2025Please refer to marked chart
A break and close of 30 min candle above 21740 i will buy - targeting zone above
A break and close below 21585 - i will sell targeting zone below
You can short if 30 min candle closes below 21665 targeting 21610 however this is too high risk
Goodluck!!!


Nasdaq market analysis: 24-Feb-2025Let’s dive into today's Nasdaq market analysis. Share insights, and potentially spot opportunities for good pips.

Upcoming Weekly AnalysisFA Analysis:
1- World economy and US economy are slowing down; risk of recession is up again.
2- Inflation is up
3- Trump tariffs and reciprocity are not helping.
4- Deep Seek news is currently behind the scene but it has a huge negative impacts on AI and semi-conductors for the ST and MT.
All the above factors are negative for stocks and equities (i.e., NQ).
5- This week, we have key data starting by the Consumer Confidence, to GDP to PCE.
Bad news is bad news for equities .
6- On Wednesday, we have NVDA earnings after market closes. This news is extremely important for the ST/MT direction. Any undershoot data will send NVDA and NQ to the LL of Year 2024. Overshoot, it will stop the drop and test back the top of the range. Inline data, it will give a short live up before resuming down. I think Inline scenario will prevail.
7- Trump tweet risk: Trump needs a daily dose of attraction; keep an open eye and manage your risk.
TA Analysis:
Weekly Analysis:
From strictly TA weekly perspective, we got an irrelevant close; we got an inside bar. But based on the FA analysis, we may consider it bearish.
Price needs to close below/above the previous weekly green candle for a decisive direction.
Daily TF:
1- We got a strong bearish close. A continuation down is expected.
2- I think market will continue the sell off until Wednesday. Based on NVDA data, we will see either:
a- Bad data: A straightforward and deep drop;
b- Inline data: A short live bounce up;
c- Green data: A retest of ATH.
That's all for this upcoming week! Trade safely and happy green week to all of you! GL!

US30 AND NAS100 LONDON SESSION STRATEGY Here i show you how you can trade Us30 and Nas100 using London session . Before trading London session you need to mark Asian range then after liquidity sweep the you trade opposite as a smart money trader.

NASQ 100 - Still trade within daily R and S range.Hello traders, please feel free to share your trading ideas, and please give a Boost if you agree with my trading plan. My trading strategy is Price Action, which is the simplest strategy of trading on the price movement. A key part of my discipline is Stop Loss set when opening a trading position, which ensures every trading is risk managed. My 1 to 1 trading training is available, please message. Trade well and good luck!
NAS100 Losing Strength? Bearish Reversal in Play!NAS100 is showing weakness to the upside, with signs of a short-term (possibly longer-term) bearish reversal. Similar to SPX, its typically bullish nature appears to be fading. How far could the drop go? No one knows for sure, but right now, the signs for strong long positions are limited.

Nasdaq 1MSmall incremental purchases and fluctuations indicate a phased entry of liquidity into the market and have created a variable or fixed support level in these stocks. A sharp decline in the short term and a return of the price to the resistance level can be expected from this analysis.
Sasha Charkhchian

US100 Is Bullish! Long!
Here is our detailed technical review for US100.
Time Frame: 12h
Current Trend: Bullish
Sentiment: Oversold (based on 7-period RSI)
Forecast: Bullish
The market is trading around a solid horizontal structure 21,588.3.
The above observations make me that the market will inevitably achieve 22,205.6 level.
P.S
The term oversold refers to a condition where an asset has traded lower in price and has the potential for a price bounce.
Overbought refers to market scenarios where the instrument is traded considerably higher than its fair value. Overvaluation is caused by market sentiments when there is positive news.
Like and subscribe and comment my ideas if you enjoy them!

Nasdaq needs a decent correction in order to gain strengthI'm not calling for a crash, but generally when markets keep pushing higher, it needs to cool off, the problem with bulls is that they have no restraint, bears are way more tactical and when bears make a move, it is fast, furious and a lot of complacent bulls get slaughtered....I expect nasdaq to reach their 0.618/0.5 retracement levels and if structure remains in tact, markets should push higher....If the correction had happened much earlier, there wouldn't be so much fear in the market....I don't expect serious buyers to step in unless nasdaq is available at more discount....You will see some short covering in between, but don't confuse that for serious buying.....There is no bottom wick in the daily candle, so basically, bulls didn't even make an attempt, also double top on daily, mini uptrend channel break, so try to focus on shorts on the way down...I could be wrong, but I don't think buyers will have much advantage unless it reaches lower levels.....

NAS100 - Can 1D Trend Hold?Dear Friends,
How I see it:
# Very strong 3 Day rejections at ATH = 22235.00
## Strong RED daily close on Friday
### Impressive 1D trend since 7th August 2024, still holding!
Potentially price can continue down looking for support -
1) 50% Fib retracement @ 21415.00
2) 1D Trend support @ 21200.00
3) Psychologic support @ 21000.00
4) Strong demand @ 20600.00 - 20470.00
Potential long - (I don't want to guess what it will do first)
1) Imbalance to fill up to 21870.00
Keynote:
If this 1D trend is breached and the break is confirmed -
Price can easily fall back down into the 17000 's region.
Thank you for taking the time to study my analysis.

Possible long ?I’m looking at going long on nasdaq
There are some economic factors to consider trump.has imposed new tariff threats softening consumer demand Tariffs would affect lumber and forest products previously imposing tariffs on imported cars semi conductors and pharmaceuticals.
Tesla has also dropped because of recalls on the cars do to electric power steering defects
However I’m curious as to what trump will say in the later days considering he uses tarrifs as a bargaining chip. We have seen the last time this has happened that Nasdaq was able to recover the following week
In addition the 1h and 1d chart looks like a cup and handles pattern and price has coincidentally dropped Friday to create the handle
Down below I have two logical areas to consider 21,570 and 21,400

NAS100NAS100 goes to redline.Because it can not jump upward support line .Last end of the week all news was bad.Target Redline .
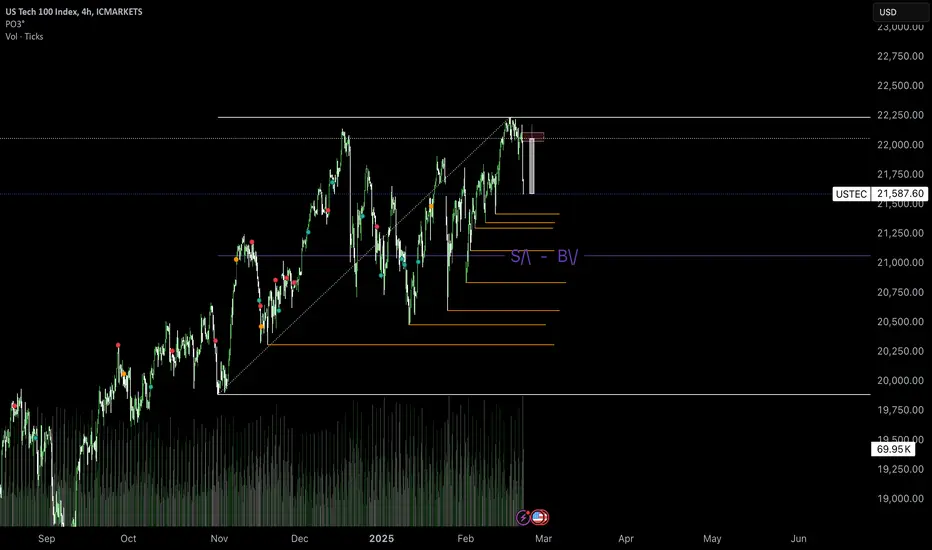
US100: Weekly Bullish, Short-Term Bearish—Two Key ScenariosThe US100 (Nasdaq) remains bullish on the higher (Weekly/Daily) timeframes, but short-term (4H/2H) indicators suggest a correction or pullback. This creates a split bias: either the market finds support and resumes the uptrend, or it breaks key levels and continues lower.
• Support Zones:
• 21,580–21,400 (immediate short-term supports)
• 21,200–21,000 (major daily support, 100 SMA area)
• Weekly Support extends down to ~19,500–21,000 on deeper pullbacks
• Resistance Zones:
• 21,900–22,000 (key intraday resistance + pivot)
• 22,200–22,300 (recent peak & bearish order block)
Scenarios
• Scenario A (Bullish Continuation)
• Look for price to hold 21,580–21,400 support and reclaim ~21,700–21,800 on higher timeframes.
• Aggressive traders may front-run a bounce near 21,580 (tight stops below 21,530).
• Conservative traders might wait for a Daily close above ~21,900 with momentum (RSI >50, bullish MACD).
• Invalidation: A daily close below ~21,000 could trigger further downside.
• Scenario B (Bearish Reversal / Deeper Correction)
• If price fails at 21,700–21,900 or breaks below 21,580 decisively, watch for a move to 21,400 or even 21,000.
• Aggressive shorts may enter on a retest of 21,700–21,800 (broken support → resistance) or a clean break below 21,580.
• More conservative bears might wait for a Daily close under 21,000–21,200 and a confirmed downtrend on momentum indicators.
• Invalidation: A strong 4H close back above 21,900–22,000 would weaken the bearish case.
Risk Management / Disclaimer
Use stops, manage position sizes, and monitor macro news. This post is for educational purposes only—not financial advice.

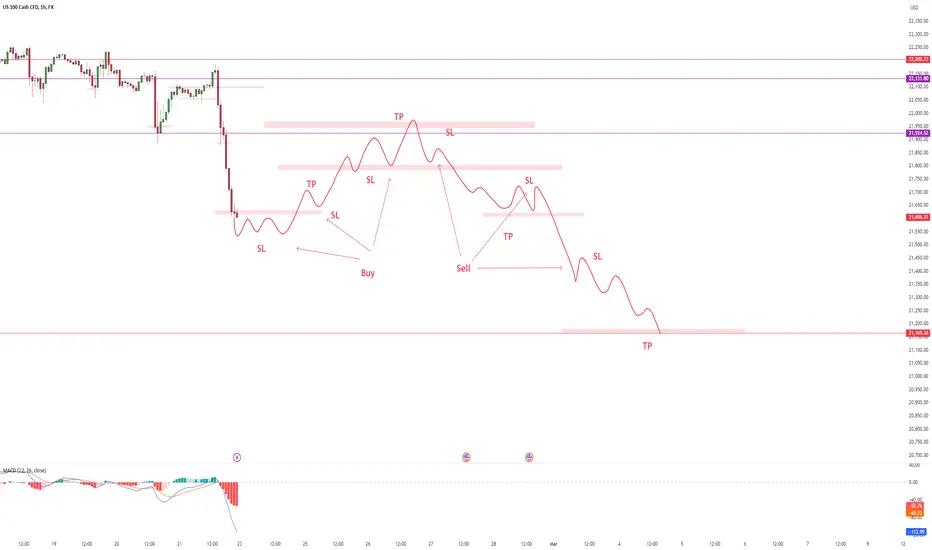
Sells for this week and buys by the end of this monthNasdaq providing us with some great opportunities over the next few weeks. very nice sale going into next week. I am hoping for an even further drop towards the end of the month then potentially a buying up on the last few days into early next month.
Could be promising.
NASDAQ - Short term downtrend.Bearish downtrend on the NASDAQ, targeting the Daily STL as nearest draw on liqudity. Expecting a retracement into the 4H BaG (Pink area) to then continue the current down-trend to sweep the liquidity at the daily STL.
As we can see, the recent bullish expansion to the upside actually took Monthly liquidity which then saw a sharp reversal which has taken out most of the bullish orderflow created in the expansion to the upside, where we created bullish FVGs moving into the HTF areas of interest. Trend turned bearish after the M high was taken, and we have created Bearish BaG on the 4H moving away from the area, as well as a potential Daily FVG being created after Mondays open.
The overall daily range for the year so far (2025) has been somewhat consolidatory, so im anticipating any move below the Daily STL we have as our target, to be a sweep and premium price action to then become our draw on liqudiity.
Happy trading!
