USNAS100 – Key Levels & Breakout Watch (3 March) 📊 USNAS100 – 3 March Market Outlook
The price is expected to consolidate between 20,990 and 20,870 until a breakout occurs.
🔹 Bullish Scenario: If the price closes a 4-hour candle above 20,990, this could trigger a push toward 21,166 and higher levels.
🔹 Bearish Scenario: A close below 20,870 would confirm a move into the bearish zone, targeting 20,670.
📍 Key Levels to Watch:
Pivot Line: 20,990
Resistance: 21,160 | 21,390
Support: 20,790 | 20,670
⚡ Outlook: Price action remains neutral until a breakout. Watch for key 4-hour candle closes to confirm the next move.
NAS100 trade ideas

USNAS100 Continues The Decline Below Pivot ZoneUSNAS100 Analysis – March 6, 2025
📉 The price is exhibiting a strong bearish trend, indicating a potential breakdown of the 20,430 support level.
The (USNAS100) continues to exhibit bearish pressure, trading below 20,570 and 20670, which now acts as a pivot zone.
Technical Outlook
🔻 Bearish Scenario: As long as USNAS100 remains below the Pivot Zone, especially below the 20430, the bearish momentum is expected to persist, with downside targets at 20,330 and 20,130. A 4H or 1H candle close below 20,330 would confirm further selling pressure, pushing the price toward 19,860 and 19,737.
📈 Bullish Reversal: If the price stabilizes above 20670, a short-term recovery could lead to a retest of 20,870 and 20,990, signaling a potential shift in momentum.
📉 Correction Movement: The price is likely to retest to around 20570 before the break and stabilize below 20430.
⚠️ Market Impact: The tariff situation and Ukraine tensions have heightened uncertainty, driving a risk-off sentiment that adds volatility to USNAS100, keeping investors cautious.
Key Levels to Watch
Resistance: 20,570 | 20,670 | 20,870
Pivot Zone: 20,570
Support: 20430 | 20,330 | 20,130
📉 Directional Bias: Bearish below 20,570 – A confirmed breakdown below 20,330 would accelerate downside momentum.

I Scanned the NASDAQ 100 – Here Are 24 Stocks with Big PotentialGreetings, fellow investors!
The past days have been mostly red, this made me take a closer look at the Nasdaq 100 index. I haven’t publicly analyzed it in a while. The last time was in 2022, here in TradingView, with the S&P 500, where I found 75 stocks that have since outperformed the index using its own tools. The last update was at the end of last year with "before" and "after" pictures.
Today’s approach is exactly the same: purely a technical opinion based on an analysis of strong and liquid price levels.
The goal of this channel is to make your life easier.
I do the technical analysis and stock selection so you don’t have to spend time on it. This time, I selected 24 stocks from Nasdaq 100, with strong technical setups. Surprisingly, there were quite a few but I will only give a brief overview of each, except for a few where I want to share more details.
The selection is done, let’s get started!
------------
Apple (AAPL)
Fun fact: The last time Apple stock could be bought based on a trendline criterion was in 2016. These opportunities don’t come often! :)
Technical criteria:
- Trendline
- Previous years' highs
- Round number $200
------------
Microsoft (MSFT)
Have shared it before where the trendline and past highs created the optimal buying zone for Microsoft stock around $300. Last year’s prediction to take profits has also worked out well.
The price is moving towards this area again, following its previous technical logic.
------------
Nvidia (NVDA)
If you bought this stock last week around $130, now there is another chance to buy it at a technically attractive level between $90 and $108. The analysis is done on the daily chart, so it's not the strongest setup but it highlights an interesting price area.
Technical criteria:
- Round number $100
- Short-term channel projection
- Equal correction waves
- Previously valid support level
------------
Amazon.com (AMZN)
Right now, it is not a bad technical area for entry. Be prepared to buy at lower levels if you decide to pull the trigger today.
------------
Alphabet (GOOG)
Based on the current price action, it seems that the price is moving towards $150 to test those levels.
The correction started sharply with several red weeks following. I would feel more comfortable entering at this range. Buying a bit earlier is not a mistake either, but I highlight the price zones where I feel technically confident.
------------
Meta (META)
If you start buying Meta at the highest marked zone, you should be prepared to add positions at all levels marked on the chart.
If you already own Meta or are waiting for lower prices, ~$500 is a level to watch. The choice is yours – at the end of the day, these are optimal areas, and the buy levels are backed by logical justification.
------------
Broadcom (AVGO)
To be honest, I don’t see a better technical opportunity on the chart. Will this setup work? 75–85% of the time, it does. That is my technical analysis accuracy rate. Add fundamental analysis on top, and the success rate could be much higher.
There are nice high highs(HH) and higher lows (HL). Additionally, there’s a clean trendline and a previous resistance level, which, if broken, will start to act as support.
Just yesterday, I was discussing with a friend how resistance turning into support works psychologically. When fuel was 1 €/liter, it was normal. Then it went up to 1.5 €/liter – way too expensive. It reached 2.2 €/liter – CRAZY! But when it dropped back to 1.5 €/liter, it felt like a normal price again. The same thing happens with those previous yearly highs, and it's the same with Broadcom – what used to seem expensive now feels normal.
------------
Tesla (TSLA)
...
💡 The full breakdown of all 24 stocks is available on Substack.
🔗 Find the link in my BIO (under the Website icon) , or if you're on mobile, just scroll down to my signature and choose your preferred language!
🚀 Before you go, don’t forget to hit the boost for this post! You don’t have to but it’s always an option. 😉
All the best,
Vaido
Disclaimer: This post is not investment advice, and the ideas presented are not recommendations to buy or sell any securities. It is intended for educational and analytical purposes, reflecting my personal view of the current market situation. Every investor should conduct their own independent analysis and consider the risks before making any decisions.

NAS100 (US 100) Buy Trade SetupHello Trader 👋
Entry: 20,154 – 20,200
• Stop Loss: 19,689
• Take Profit 🎯: 21,061
Analysis:
• Price has broken the downward trend and is showing bullish momentum.
• If it stays above 20,154, it may move towards 21,061.
Strategy:
• Buy above 20,154 after confirmation.
• Stop Loss at 19,689 to manage risk.
• Take Profit at 21,061 for a potential upside move.

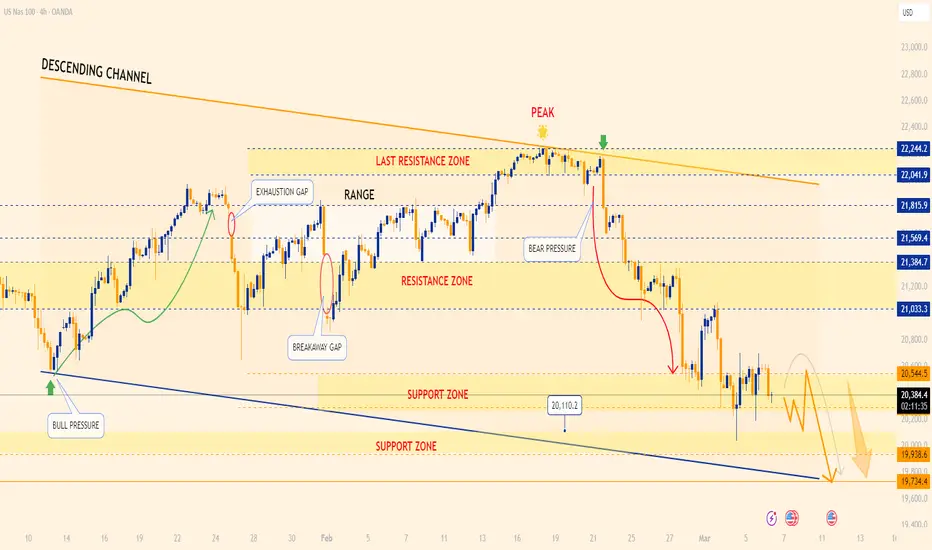
USNAS100| Drop as Wall Street Volatility ContinuesThe US NAS100 price Fell. The declines come after the White House said Wednesday that it would grant a one-month delay for tariffs on automakers whose cars comply with the United States-Mexico-Canada Agreement. This fueled traders’ hopes that Trump could provide further exemptions, lifting the major averages on Wednesday.
The price declined as anticipated and has stabilized below 20,545. Today, it is expected to attempt a breakout at 20,290 to reach the next support zone between 20,110 and 20,935. Should the price fall below this zone, the next key support level is at 19,735.
Bearish target: 20,290. 20,110. 20,935.
From a technical perspective, a confirmed bullish reversal would require a breakout above the resistance zone between 21,385 and 21,030.
Bullish target: 20,545. 21,385. 21,030.
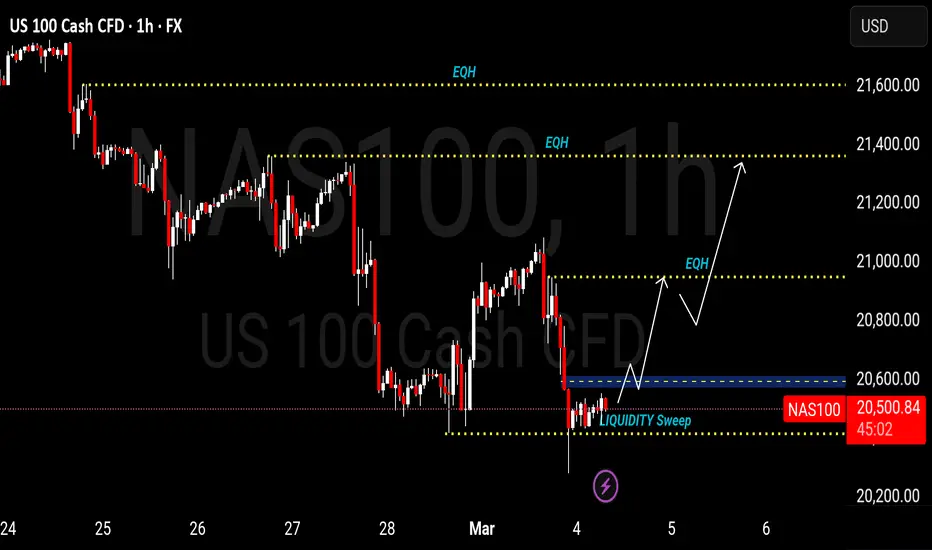
Nas100 -SMC Whether you're going short or long, these key price levels provide you with a unique advantage, helping you navigate the market with precision and make more informed decisions based on real liquidity zones and institutional activity.
Bearish Trend Below Pivot Zone Amid Tariff UncertaintyUSNAS100 Analysis – March 4, 2025
📉 Bearish Momentum Holding Below Pivot Zone
The NASDAQ 100 (USNAS100) continues to exhibit bearish pressure, trading below 20,570, which now acts as a pivot zone. The price has stabilized near 20,502, suggesting a possible short-term correction toward 20,570 before resuming its downtrend.
Technical Outlook
🔻 Bearish Scenario: As long as USNAS100 remains below 20,570, the bearish momentum is expected to persist, with downside targets at 20,330 and 20,130. A 4H or 1H candle close below 20,330 would confirm further selling pressure, pushing the price toward 19,860 and 19,737.
📈 Bullish Reversal: If the price stabilizes above 20,570, a short-term recovery could lead to a retest of 20,870 and 20,990, signaling a potential shift in momentum.
📉 Correction Movement: The price is likely to retest 20,570 from 20,502 as part of a correction phase before resuming its decline.
⚠️ Market Impact: The tariff announcement on Canada and Mexico has intensified selling pressure. If the decision is reversed, a strong bullish reaction could occur, shifting market sentiment.
Key Levels to Watch
🔸 Resistance: 20,670 | 20,870 | 20,990
🔹 Pivot Zone: 20,570
🔻 Support: 20,330 | 20,130 | 19,860
📉 Directional Bias: Bearish below 20,570 – A confirmed breakdown below 20,330 would accelerate downside momentum.

USNAS100 Extends Losses Below Pivot Zone Amid Tariff PressureUSNAS100 Analysis – March 5, 2025
📉 The price dropped about 450 points, as we mentioned yesterday, ahead of the tariffs situation. Bearish Momentum is Holding Below the Pivot Zone
The (USNAS100) continues to exhibit bearish pressure, trading below 20,570 and 20670, which now acts as a pivot zone.
Technical Outlook
🔻 Bearish Scenario: As long as USNAS100 remains below the Pivot Zone, the bearish momentum is expected to persist, with downside targets at 20,330 and 20,130. A 4H or 1H candle close below 20,330 would confirm further selling pressure, pushing the price toward 19,860 and 19,737.
📈 Bullish Reversal: If the price stabilizes above 20670, a short-term recovery could lead to a retest of 20,870 and 20,990, signaling a potential shift in momentum.
📉 Correction Movement: The price is likely to retest 20670 from 20570 as part of a correction phase before resuming its decline.
⚠️ Market Impact: The tariff announcement on Canada and Mexico, and China has a bearish momentum pressure.
Key Levels to Watch
Resistance: 20,670 | 20,870 | 20,990
Pivot Zone: 20,570
Support: 20,330 | 20,130 | 19,860
📉 Directional Bias: Bearish below 20,570 – A confirmed breakdown below 20,330 would accelerate downside momentum.

NAS100USD Will Go Higher! Buy!
Take a look at our analysis for NAS100USD.
Time Frame: 1D
Current Trend: Bullish
Sentiment: Oversold (based on 7-period RSI)
Forecast: Bullish
The market is testing a major horizontal structure 20,175.5.
Taking into consideration the structure & trend analysis, I believe that the market will reach 21,410.0 level soon.
P.S
Overbought describes a period of time where there has been a significant and consistent upward move in price over a period of time without much pullback.
Like and subscribe and comment my ideas if you enjoy them!

NSDQ100 The Week Ahead 10th March '25Sentiment: Neutral, Price action is consolidating in a tight trading range.
Resistance: Key Resistance is at 20660, followed by 21000 and 21315.
Support: Key support is at 19660 followed by 19300 and 18914.
This communication is for informational purposes only and should not be viewed as any form of recommendation as to a particular course of action or as investment advice. It is not intended as an offer or solicitation for the purchase or sale of any financial instrument or as an official confirmation of any transaction. Opinions, estimates and assumptions expressed herein are made as of the date of this communication and are subject to change without notice. This communication has been prepared based upon information, including market prices, data and other information, believed to be reliable; however, Trade Nation does not warrant its completeness or accuracy. All market prices and market data contained in or attached to this communication are indicative and subject to change without notice.

USTEC,NAS100USTEC price is at resistance zone 22210. If price cannot break through, we expect a correction. Consider selling red zone.
🔥Trading futures, forex, CFDs and stocks carries a risk of loss.
Please consider carefully whether such trading is suitable for you.
>>GooD Luck 😊
❤️ Like and subscribe to never miss a new idea!

Nasdaq | Long | 3HrsThis technical analysis is for informational and educational purposes only. It does not constitute financial advice. Remember to always research and consult with a professional before making investment decisions. Good luck! 📈💼🚀

Nasdaq Scenario NFP day 07/03/2025English : According to our analysis, we expect the NFP to have a negative impact on the dollar, so we anticipate a Bearish scenario.
Morocan Darija : NFP kanchofo d'apres l'analyse dyalna ayji negative l dollar hadchi 3lach kanchofo Us30 Bearish
ATENTION : I only share my ideas, not signals.

US100 - Bearish possibility- Support zone broken that transformed in to resistance
- Downtrend being hit for the third time, still strong because base on past technical history it takes four to five hit before high break probability
- Price struggling to break resistence zone
*Educational purpose only

Potential pullback and bearish continuationNasdaq is ranging between 22000 and 20500, and price action is currently bouncing off the 20500 support. As long as price action is above the 20500 barrier, price action may try to reignite a bullish rise towards the established highs.
Failure to continue up and settling under 20500, the indice may now be in a bigger bearish phase. However, if the price action manages to stabilise above the 21300, the indice will probably aim the 22000 barrier.

NASDAQ 100: Is a Bottom Forming? Key Levels and Risk-Reward InsiThe NASDAQ 100 is testing its 200-day moving average, a historically significant level for trend reversals. If it holds, the risk-to-reward setup looks attractive, with potential upside of up to 9% versus a limited downside. The we consider past reactions, political factors, and trade dynamics. A break above key resistance could confirm the move, though waiting for a V-shaped recovery might impact the reward ratio. What do you think? Share your thoughts.
This content is not directed to residents of the EU or UK. Any opinions, news, research, analyses, prices or other information contained on this website is provided as general market commentary and does not constitute investment advice. ThinkMarkets will not accept liability for any loss or damage including, without limitation, to any loss of profit which may arise directly or indirectly from use of or reliance on such information


NASDAQ Index Analysis – Daily TimeframeThe NASDAQ Index is currently in a corrective wave, and for now, it may remain range-bound in terms of time.
🔹 The key support level in the long-term timeframe is 19,800. Once the correction phase is over, the index could resume its upward movement toward 23,300.
🔹 In the medium-term, the critical level to watch is 21,200.
📈 If the correction completes, the expected growth is approximately 20%.

Long US100, NQ, NAS100Long, it will tp in 1 week, great risk to reward trade, swing trade.
Use proper risk management
Looks like good trade.
Lets monitor.
Use proper risk management.
Disclaimer: only idea, not advice.

Bullish pullback Nasdaq is still in a bearish trend, but price action may rise and retest the 20700-20900 barriers to reignite the continuation of the bearish move. If price action remains under 20900-20700, the bearish pressure may still be possible. However, if the indice goes above 20900-20700, a bullish growth may happen.

NASDAQ Potential Bullish Retracement (After Major Correction)NASDAQ price seems to exhibit signs of a major correction as the price action has broken out of it's range.
During the pandemic (Covid-19), NASDAQ experienced two major corrections (worth drops of approx. 18.35% and approx. 24%). Counting these two massive corrections as anomalies, the NASDAQ on average retraces maximum around approx. 17% - 18.5% from a historical perspective.
Once the selling subsides we may potentially see the formation of a credible Higher Low on the Longer Timeframes with multiple confluences from key Fibonacci and Support levels.
The current Trade Plan caters to a drop of approx. 22.5% (to be on the safer side and potentially accounts for a major correction excluding massive systematic failure).
Trade Plan :
Entry @ 19250
Stop Loss @ 17140
TP 1 @ 21360 (Before All Time High)
TP 2 @ 23470 (After All Time High)
Note: Move Stop Loss to Break Even if TP 1 hits.

NDQ is kissing SMA 200 being under SMA 50: bears in controlHello everyone!
Once upon a time, I read the thesis that Algos would start selling aggressively if the Ticker reached its SMA 50 Close. If the ticker reaches and breaks down its SMA 200, the sell-off continues, and we can call the environment bearish, not being formally in a bear market. Under a Bear market, we assume here a decline from the latest top ~20% for the major indices.
Fine. The practical question is how to use this information for your trading strategy as a retail trader?
For me, it is still a work in progress.
Why? I am a relatively newbie in the market (since 2019), so my learning curve is in progress. For example, I understood, based on my reduced deposit in 2022, that defining the environment, then relatively strong sectors and tickers makes sense and really helps to decide what trading strategy to apply to the stock that performs stronger vs. the general market ( SP:SPX , for example) or the weakening stock.
From the chart above, the obvious conclusion is that NDQ is weakening and at a decision moment, so trading long the bounces intraday and mainly keeping the longs overnight is a risky approach. I like to sleep well, so I do not hold long overnights. Now, it does not matter how the chart is; it is amazingly tempting to do so. Learned the hard way. Conversely, I play longs intraday because bounces might be rewarding during the intraday.
For sure, all boring stocks from a field of defensive sectors are now more right to be with longs according to textbooks. Everyone chooses their way.
Stay profitable!

US100 Making HH,HL at one hour Time Frame Buy at Current Priceus100 has created first HH and now
it is moving toward making another HH after correction from fib level 0.618 at 1 hour
SL: 20024
BUY AT Current Price: 20400
TP: 20776
