Bearish Nasdaq Eyes Key Levels Amid Jobs Data Watch!In the current scenario, a rise to the 20,839.55 level presents an opportunity to continue the downtrend, targeting the 20,227.50 level in the short to medium term.
The bearish scenario will be invalidated if the price rises above 21,077.98 and closes a daily candlestick above this level.
Note:
Markets are awaiting the U.S. employment data today, with expectations pointing to an increase in non-farm payroll employment change to 153K, while the unemployment rate is expected to remain at 4.0%. The data will be released at 5:30 PM Dubai time and is expected to have a direct impact on the markets, particularly U.S. indices, gold, and currency pairs involving the U.S. dollar.
Traders are advised to pay close attention to this data, as it will directly impact the above analysis upon its release. It will be the main driving force based on its results, which could weaken the validity of the mentioned technical analysis scenario.
NAS100 trade ideas

NAS100 | Bulls Fighting Back! Key Reversal Zones in Play SMART MONEY CONCEPT
🌍 Market Sentiment & Economic Factors
📉 NAS100 has been under pressure due to rising Treasury yields and hawkish Fed commentary. However, recent price action suggests buying interest at key demand zones. Investors are closely watching economic data releases this week, including NFP & CPI, which could determine the next big move.
💰 Federal Reserve & Interest Rate Impact
The market remains uncertain about the Fed's next rate move. If inflation cools down, expectations of a rate cut will likely boost tech stocks, pushing NAS100 higher. However, stronger data could keep pressure on equities, leading to further downside.
🏦 Tech Sector Strength
Big tech earnings have shown resilience, but concerns over valuations persist.
📉 Technical Analysis (1H Timeframe)
🔥 Market Structure & Key Levels
🔹 Demand Zone Holding Strong:
Buyers stepped in aggressively at 20,275.05, leading to a strong rejection and a shift in momentum.
A Change of Character (ChoCh) was confirmed, signaling potential trend reversal.
🔹 Resistance & Target Levels:
First Key Resistance: 21,141.25 🏁
Major Supply Zone: 22,113.51 (Break above = strong bullish confirmation 🚀)
🔹 Breakout Scenario:
A break above 21,141.25 would confirm bullish continuation toward 22,113.51.
A failure to hold current support could trigger a retest of 20,275.05.
📊 Volume & Liquidity Analysis
🔸 Recent high volume at demand zone suggests institutional interest.
🔸 Liquidity buildup above 21,141.25 could act as a magnet for price.
🎯 Trade Plan & Bias
📌 Bullish Above: 21,141.25 (Target 22,113.51) ✅
📌 Bearish Below: 20,275.05 (Downside risk if structure breaks ❌)
🔎 Final Thoughts:
The market is at a turning point – will bulls maintain control, or is this just a temporary bounce? Keep an eye on key resistance zones and macroeconomic events for confirmation! Drop your thoughts below! 🔥

Dollar Strength = Market Weakness ( MARKET REVIEW ) Dollar strength seems to be coming more into play this current week with a bullish close above 107 for last weeks candle .
This dollar strength has given us insight to look for positions in other markets for potential short trades. Take a look for more deeper insight or direct message me for more information.

Looks Potentially like some relief ralliesLooking at the market holistically, it would appear like opportunity will present in DXY weakening, and metals again this week, looks like the week might play out as a relief rally for S&P and NASDAQ as both sentiment and fear are at extremes.

Approaching short-term bottom, watch for potential rebound(The following is solely a personal opinion and not investment advice. Please make your own judgment before making any decisions.)
Last week, after rebounding to 21,075 on Monday, the price maintained a downward trend.
Currently, the price is approaching a key short-term support level and has fallen below the 200-day moving average. There is a high probability that the market will bottom out and rebound in near term.
Potential Rebound Scenario
If the market rebounds next week, the price may consolidate and form a base on Monday and Tuesday. By Wednesday and Thursday, it should at least break above 20,700 and stay above this level.
Continued Downtrend Scenario
If the rebound holds, the price should remain above 19,650. However, if it breaks below this level and stays below, further downside to 19,000 is likely.
Watch Wednesday's CPI Data
If Wednesday’s inflation data meets or lower than expectations, it could provide fundamental support for a market rebound. The initial rebound targets for next week are 20,700 and 20,900. If the CPI data is positive an upward breakout toward 21,345 could occur.
Further Downside Risk After Rebound
Even if the price breaks above 21,345, attention should be paid to its behavior in the 21,400–21,600 range and whether overbought conditions arise. The market may resume a downtrend after completing the rebound, so caution is advised when chasing highs.

Nasdaq testing 200-day moving averageThe Nasdaq Index, technology stocks is testing the 200-day moving average. It's at a critical juncture—either breaking down or rebounding. If it drops below the 200-day moving average, a prolonged correction could last for nearly a year.

NAS100 - Potential TargetsHow I see it:
Key resistance @ 21000.00
LONG, Requires a clear brake above key resistance -
TP 1 = 21322.00
TP 2 = 21870.00
and / or
SHORT, Requires a breach of key support @ 20407.00 area -
TP 1 = 19910.00
Thank you for taking the time to study my analysis.

NVIDIA shines, but can NASDAQ hold up?After NVIDIA's positive earnings were released yesterday, today's focus shifts to the U.S. GDP data on a quarterly basis. Expectations suggest a steady growth rate of 2.3%. If the U.S. growth exceeds this rate, it could lead to a rise in the U.S. dollar and potentially negatively impact American indices like NASDAQ, due to the likelihood of maintaining higher interest rates for an extended period.
Technically, the NASDAQ index has recently declined, moving in a general downward direction by forming successive lows lower than each other. The corrective rise to the level of 21453 could be seen as an opportunity for a rebound downwards and a continuation of the downward trend, with the first target located at the level of 21086. On the other hand, a potential positive scenario would involve prices rising above the level of 21596 and recording a higher peak, indicating a breakthrough of the last lower high recorded by the market, suggesting a change from a downward to an upward trend.

NASDAQ– Key Trendline Test & Support Levels
The Nasdaq 100 (NDQ100) has been under selling pressure as investors weigh macroeconomic factors, including Federal Reserve policy decisions and technology sector earnings. While AI-driven stocks have shown resilience, broader concerns about interest rates and valuations have led to increased volatility.
The latest economic reports indicate mixed signals: GDP growth remains steady, but inflation remains stubbornly high. The Fed’s stance on potential rate cuts is uncertain, adding to investor caution. Additionally, geopolitical tensions and supply chain disruptions continue to pose risks to growth stocks, making technical levels highly significant for traders.
Technical Analysis
Timeframe: 1D
Trendline Retest: NDQ100 is currently testing a long-term ascending trendline, which has provided dynamic support since mid-2024.
Key Levels to Watch:
Support Zones:
20,681.94 – A critical level where buyers may attempt to regain control.
20,000.00-19,500.00 (Blue Zone) – A broader support area where demand has historically been strong.
Resistance Levels:
21,247.62 – The immediate resistance level that bulls need to reclaim for a recovery.
Bearish Breakdown Risk: A sustained break below 20,681.94 could accelerate selling pressure, pushing the index toward 19,500.00 and below.
Bullish Scenario: If NDQ100 holds the current trendline and rebounds, we could see a push back toward 21,247.62, confirming continued bullish structure.
Final Thoughts
The Nasdaq 100 is at a make-or-break level. Holding the trendline could trigger a bullish reversal, but a breakdown could lead to deeper declines. Macroeconomic developments and earnings reports will be key catalysts in the coming weeks.
📌 What’s Your Take? Bullish or Bearish? Drop your insights below!

US 100We might see a bullish move in US100 today after the break of structure and liquidity grab from equal lows on the 15-minute timeframe. The price has returned from the rejection block or order block that caused the break of structure. Hopefully, we will see a strong bullish move in US100 today.
This is not a signal, just a general market analysis. Please manage your risk properly.

Nasdaq 100 Hits Yearly Low, Led by NVDA DeclineNasdaq 100 Hits Yearly Low, Led by NVDA Decline
The Nasdaq 100 (US Tech 100 mini on FXOpen) has fallen below 20,500 for the first time since November 2024.
Bearish sentiment driven by:
→ The latest US jobless claims report, which showed the highest figures of 2025.
→ Concerns over the destabilising and economically damaging potential of Donald Trump’s trade policies.
Nvidia (NVDA) Among the Biggest Losers
While the Nasdaq 100 lost over 2.5% in yesterday’s session, Nvidia (NVDA) shares plunged nearly 8% despite a stronger-than-expected quarterly report, as we noted yesterday.
Technical Analysis of the Nasdaq 100 (US Tech 100 mini on FXOpen)
The ongoing decline has resulted in a bearish breakout of the trendline (marked in blue) that originated in 2024. Based on key reversals (highlighted with red circles), the chart now outlines a descending channel. An attempted breakout (indicated by an arrow) failed, forming a bearish Rounding Top pattern.
If bearish sentiment prevails—especially with focus on inflation data, as the Core PCE Price Index is set to be released today at 16:30 GMT+3—Nasdaq 100 (US Tech 100 mini on FXOpen) may drop further towards the lower boundary of the descending channel.
Trade on TradingView with FXOpen. Consider opening an account and access over 700 markets with tight spreads from 0.0 pips and low commissions from $1.50 per lot.
This article represents the opinion of the Companies operating under the FXOpen brand only. It is not to be construed as an offer, solicitation, or recommendation with respect to products and services provided by the Companies operating under the FXOpen brand, nor is it to be considered financial advice.

US 100Return to the order block and the market turning bullish to capture higher liquidity.
This is not a signal, just my personal analysis.
Please don't forget risk management.

Long US100, NAS100, NASDQ, NQ - Swing PositionLong, it will hit tp in 1 week, great risk to reward trade, swing trade.
Please Note: I have BE the other trade I have open on this, I want to close it on BE and keep this position running for long.
Use proper risk management
Looks like good trade.
Lets monitor.
Use proper risk management.
Disclaimer: only idea, not advice

NASDAQ SELLS Bearish Breakout (Most Probable): The price breaks down from the ascending triangle. This could involve:
Rejection at 20,486.0 followed by a break below the lower trendline of the ascending triangle.
Direct break below the lower trendline without significantly testing 20,486.0 again.
This would signal a continuation of the downtrend established by the bearish BOS.
Continued Consolidation (Less Probable, but Possible): The price might continue to trade within the ascending triangle for a bit longer. However, even in this case, the underlying bearish pressure would still favor a bearish resolution eventually.
Unexpected Bullish Breakout (Least Probable): While less probable given the bearish BOS, an unexpected bullish breakout above 20,486.0 is always possible in markets. However, for this to happen, there would need to be a significant shift in market sentiment and buying pressure to overcome the established bearish momentum. This would be considered a lower probability scenario given the current chart context.

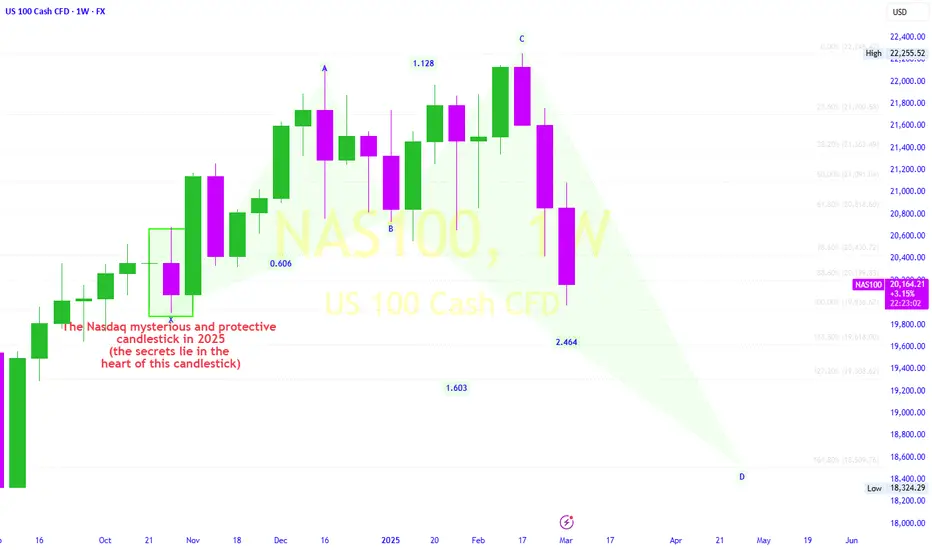
2025 Outlook: Correction and Harmonic PatternsThe NASDAQ , after peaking at an unprecedented 22,000 in 2024, has begun a corrective phase driven by pausing Federal Reserve interest rates, concerns over tech-sector profitability, and escalating geopolitical tensions and Trump Commands. This pullback reflects a shift away from growth stocks toward safer assets.
As outlined in this Chart, the index is now validating a bearish harmonic pattern (Crab), which typically signals major trend reversals.
The pattern’s completion zone aligns with key Fibonacci retracement levels (61.8–78.6%) of the 2022–2024 bull run, projecting downside targets:
- Near-term support: 20,000–20,500 (dynamic support near the 100-week moving average).
- Intermediate zone: 19,000–19,500 (50% Fibonacci level and long-term trendline confluence).
- Final target: 18,500 (78.6% Fibonacci retracement and psychological “golden support”).
Macro risks, such as prolonged restrictive monetary policy, slowing AI-driven earnings growth, and U.S.-China and US-Europe trade tensions, could accelerate this decline.
Traders are monitoring a decisive break below 20,500 with high volume to confirm bearish momentum, while a rebound from 18,500—coupled with reversal patterns like a double bottom may signal a short/mid-term buying opportunity.
This outlook hinges on earnings reports from mega-cap tech firms (Microsoft, Apple, NVIDIA) and Federal Reserve policy guidance.
USNAS100 Drops 800+ Points – Key Support Test Ahead!📉 USNAS100 Technical Analysis – February 28, 2025 📉
The price dropped over 800 points (-3.8%), exactly as we projected in yesterday’s bearish outlook .
📌 Key Event Today:
Traders should watch for the Core PCE release, which could impact the market significantly. Additionally, any updates on Trump's tariffs or geopolitical tensions between Ukraine and Russia could drive volatility.
🔍 Technical Outlook:
Consolidation Zone: 20,670 – 20,550 until a breakout occurs.
Bearish Continuation: A 4H candle close below 20,550 could accelerate downside momentum toward 20,330 – 20,130.
Bullish Correction: A 4H close above 20,670 could push the price toward 20,810 – 20,990 as a potential retracement.
📊 Key Levels to Watch:
🔸 Resistance: 20,810 | 20,990 | 21,166
🔹 Pivot: 20,670
🔻 Support: 20,550 | 20,330 | 20,130
🚀 Will NAS100 hold this support, or is more downside coming? Drop your thoughts! 👇🔥

nas buy limitnasdaq is in a bearish move for a short time... but the channel support at 19500 is ahead, that can cause a possible reversal to long move again for all time high again. so we try to place a buy limit order wit sl of last support at 18500... and if we got sl we try to buy from this level again with sl below 16500-17000 ... hope this trade will go accordingly inshallhaa

NFP Big Day: How does impact NQ?Good day!
Today is a big day for many reasons, but mainly to clear the context of uncertainty.
1- How to read and translate NFP data?
* Inline data: It's positive for equities; it's a ST relief.
* Overshoot: This is tricky: the Average Hourly Earnings must be inline or below expectation of 0.3% and strong green the two other components (NFP and Unemployment Rate). This overshoot will be very well received.
In the case of Average Hourly earnings positive, it will become a mixed data with unknown behavior from the market.
* Undershoot (the opposite of overshoot): NQ will drop to the final target 19620.
2- Powell and other FED members will speak today: In the current context, FED members might hint certain openness for printing free money and rate cut.
Any hint of this type will send NQ up and absorb/erase any undershoot from NFP data.
3- Unpredicted news from Trump's team: As they're following closely the stock market, there is a big chance that they intervene in the case of undershoot NFP with candies and carrots.
Hence, it will be very difficult to trade today. The up and down will be furious.
GL!

Possible BUYI will be looking for a buy position after the liquidity is taken from the previous low. I will be looking to enter on the FVG which is highlighted with the box. TP would be the previous high and we could potentially go higher

Nas NFP possible buy I have been waiting for this level for a hwile now we might see the big move your a continuation downwards, lets see what happens during USD market open

US100My option about us100 Is more bullish so that zone is good and strong support,if the price comes to that zone it can pullback

Nasdaq bounced from major supportNasdaq bounced from major support. It may pause for a while waiting for any fundamental news before downtrend continues.

US100 Short From Resistance!
HI,Traders !
US100 has retested a
A horizontal resistance
Of 20669.2 from where
A bearish reaction can be
Observed already and so
We will be expecting a
Further bearish correction !
Comment and subscribe to help us grow !
