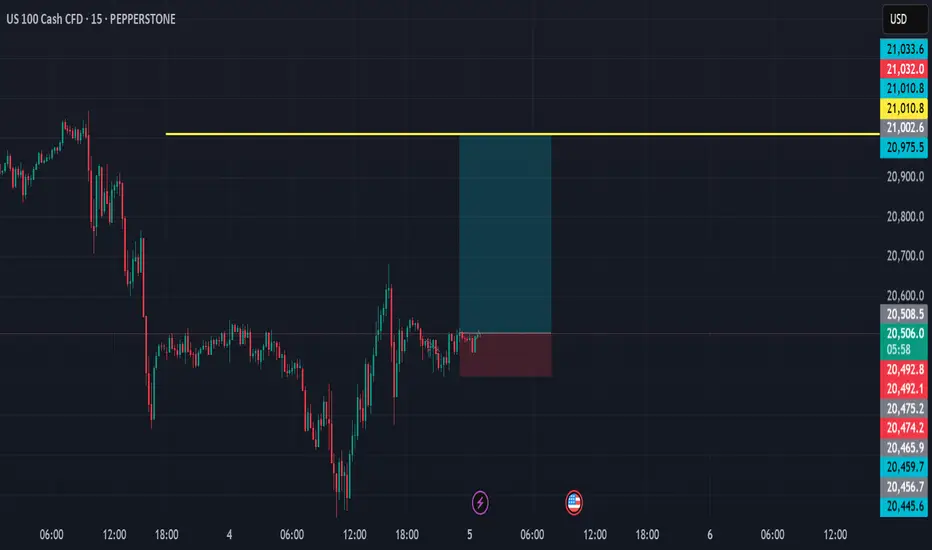
Short IDEA for US100 At 15 Minute Time FrameMarket has touched the 0.618 Fib Level and there are chances that it goes down further.
This is a risky trade as there is no trend but chances of trend.
0.15% R:R
SL:21074
Entry: Current Price: 20852
TP: 20630
NAS100 trade ideas

NAS100 - Nasdaq, won't it go below 20k?!The index is below the EMA200 and EMA50 on the four-hour timeframe and is trading in its medium-term ascending channel. If the index rises towards the suggested zones, we can look for the next Nasdaq sell-off.
The composition of investors’ financial assets from 1990 to 2025 reveals shifts in the allocation of equities, bonds, and cash. Currently, the share of equities in investment portfolios has reached an all-time high of 54%, indicating a growing preference for the stock market among investors.
Conversely, the share of bonds and cash has declined to 18% and 13%, respectively, suggesting reduced interest in holding fixed-income assets and liquidity. At present, more than half of investors’ financial assets are concentrated in equities, which could reflect optimism about the market’s future growth.
This situation calls for increased caution from the Federal Reserve and the Trump administration, as a significant portion of American households’ surplus income is now directed toward stocks. As a result, any downturn in the U.S. stock market could have more severe consequences for the public than before.
Scott Bassett, the U.S. Treasury Secretary, responded to a recent survey indicating that Americans want President Donald Trump to focus more on reducing inflation. He stated that he is confident consumer price inflation in the United States will decline throughout the year.
In an interview with CBS and Face the Nation, Bassett defended Trump’s economic policies, emphasizing that the president is pursuing a comprehensive approach that includes tariffs, deregulation, and a gradual reduction in energy costs.
Meanwhile, following weaker-than-expected preliminary Purchasing Managers’ Index (PMI) data for February and a decline in the University of Michigan’s Consumer Sentiment Index, investors are now pricing in approximately 60 basis points of rate cuts by the Federal Reserve for this year. This projection is 10 basis points higher than the forecasts from the December dot plot.
Market pricing indicates that traders still expect the Federal Reserve to cut interest rates in June, particularly after the release of Personal Consumption Expenditures (PCE) data. However, with Trump ramping up tariff threats against key U.S. trading partners such as China, Canada, and Mexico, outlining a clear economic roadmap has become more challenging. Tariff impositions pose a serious risk of reigniting inflation, prompting many Federal Reserve officials who have recently expressed their views to adopt a “wait and see” approach.
This week, market attention will once again turn to employment data, as investors eagerly anticipate the release of the February Non-Farm Payrolls (NFP) report. Other key events include the preliminary Consumer Price Index (CPI) estimates for the Eurozone and the ISM U.S. Manufacturing PMI on Monday, the ADP Employment Report and ISM Services PMI on Wednesday, and the weekly jobless claims data on Thursday. Additionally, the European Central Bank’s monetary policy decision on Thursday will be closely watched, with economists expecting another interest rate cut.

NAS100 BUY ANALYSIS SMART MONEY CONCEPT Here on Nas100 price has form a a demand around area of 20676.30 which is likely to continue moving up as more traders will likely to come and push the price up so trader should go for long with expect profit target of 21349.74 and 21946.22 . Use money management

NQ: Upcoming weekly analysis!FA Analysis:
1- Last week macro economic data came +/- inline which did not help to resolve the UNCERYTAINTY.
2- Trump tariffs flip plop confirmed the uncertainty.
3- This week, we have Job Jolts, CPI. PPI and Consumer confidence; they're all key data to resolve the uncertainty. Inline data won't help; we need an overshoot or undershoot.
So until data news, price will continue in the consolidation and accumulation.
TA Analysis:
Weekly TF:
We got a clear bearish close with a somewhat large wick. With the uncertainty context until Tuesday and Wednesday, price might move up to retest 20627. as shown in the chart.
Daily TF:
From daily perspective, we got a bullish close after price was rejected at Weekly support.
Hence, I see price moving up toward 20529-20627.
The chart shows the uncertainty via Extensions (represented by E in the chart).
Price was unable to close below 20529 for 6 days creating extensions but no break. This tells you the battle between buyers and sellers to break or reject that level. All were fueled by inline data and tariffs flip plop.
As a conclusion, I think the break down is not a question of IF but WHEN.
Happy green week Everyone!

NASDAQ LAST LONGS RECESSION GONGS: its a TRUMPCESSIONWe have many takes for me ive been waiting for this moment my whole year FY24
somewhere around 23-24k its gonna be showtime im making this idea brief
price back at resistance expecting a break and retest after it rejects and goes higher
also impulse might not even complete considering how strong the support is
dxy wiped out months progress in 4 days
investors are gonna seek safe havens i hope trump listens to expert advisors
like steve hanke
in my opinion
the markets have always been too overbought - SELL
the u.s is losing trust and likeability among allies with these tariffs
the u.s has entered trade wars wether its too strong a phrase to bring up
booms and bust ou cant rig the economy the time cycle has arrived

Uncertainty until NFPYesterday close confirmed again the uncertainty and provided an inside, irrelevant daily candle.
It seems the upper TL working as resistance. It worked nicely yesterday.

POTENTIAL LONG TRADE SET UP FOR NAS100 Analysis: Utilizing chart patterns, highs & lows, and impulses & corrections, the focus is on identifying a continuation corrective structure following a breakout.
The price approached the lower bound of a bullish continuation structure on the higher time frame (HTF) with a broadening descending structure on the Mid time frame (MTF). We will now monitor for a bullish impulse and continuation structure on the LTF to identify a potential entry point for the trade.
Expectation: An upward move is expected.
⚠️ Reminder: Always conduct your own analysis and apply proper risk management, as forex trading involves no guarantees. This is a high-risk activity, and past performance is not indicative of future results. Trade responsibly!

NASDAQ BUYSWeve had quite an interesting run on NAS. The current potential for me at this point is upside, keeping the risk at a minimum. this could be an interesting trade from a long term view. trade executed. lets see how this plays out.

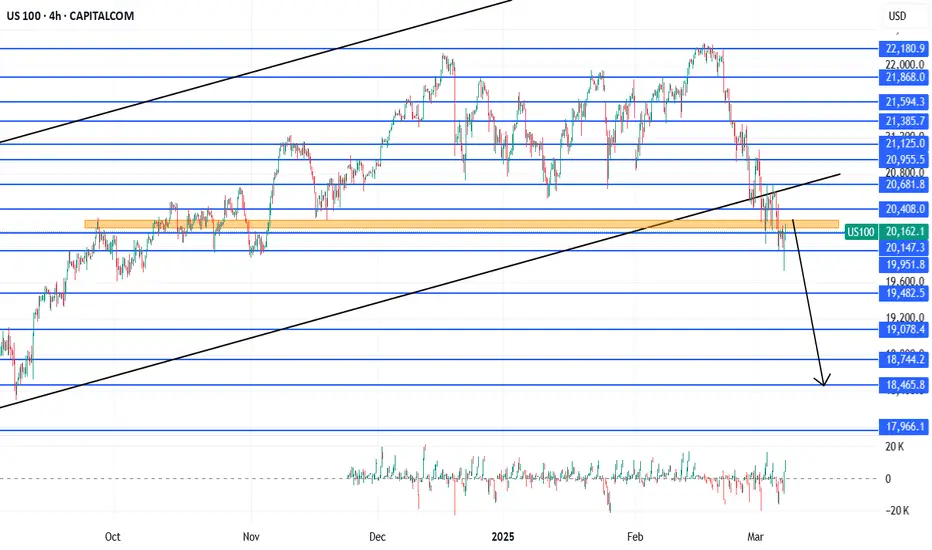
Potential Massive SellIf price hits hits the upper part of the H4 resistance zone which is at 20300.7, and fails to break out above that level, then i foresee a massive sell downward to 18456.8
PIVOTAL POINTAfter three weekly bearish candles, there seems to be some dope rejections from this low, price action promises that there will be a stop here or a bit further manipulative sell into the range of the zone, the closing of the week might direct us into understanding if next week carries some weekly retracement buys or if we still will be stuck on the zone

CHART BREAKDOWN NASDAQ: Key Levels, Targets and Thoughts!Brief Description🖊️:
The chart provides insights into critical market levels, emphasizing an essential supply zone: low-risk sell zone spanning from 20.520 to 20.560, respectively, are highlighted.
Things I Have Seen👀:
Important Supply Zone🟢: Identified between 20.520 and 20.560 serving as a low-risk sell.
Bearish Targets📉:
20.480: Possible retracement area.
20.400: Possible retracement area.
20.230: Liquidity area.
20.000: Liquidity area.
What's Important Now❗
Currently, the crucial approach is to wait and observe the price action at this level. We need to assess how the market reacts before considering any decisive moves. Stay observant and responsive to real-time developments in the market.

TP FILLED ON NASDAQCouple minutes ago, I posted to sell NASDAQ, and now the market reached our TP.
Follow for more trades!

NAS100 Downtrend Nearing Its End? Bullish Move Incoming!The NAS100 downtrend could be running out of steam this week as price stabilizes around a key trendline. With a fourth test on the horizon, a break higher could signal the start of a bullish move—though it may be short-lived. Will buyers step in to reclaim control? Watch for key levels and potential reversals!

QQQ - NASDAQ Has Never Been This ExpensiveQQQ relative to money supply reveals that markets have never been this expensive in history, despite all the money that was pumped in over covid.
Tulips!
Caution is in order despite what "experts" may tell you.

NAS100 BUY 15 MINUTE TIMEFRAMEStrong Demand Zone
Price has to fill the gaps to the left
4:63 Risk Reward
Let’s See:)
Actionable Nasdaq insights: 05-Mar-2025Rise and shine, traders! Start your day with actionable Nasdaq insights. Let's grow your skills together, one chart at a time.

NASDAQ WILL GO HIGHER, BUY AFTER PULLBACKFundamentals
Recent economic data indicates mixed sentiments in the tech sector, with rising interest rates and concerns about valuations weighing on growth stocks. However, optimism surrounds potential technological advancements, such as AI and renewable energy sectors, driving long-term bullish expectations.
Technicals
After the bullish spike following the CPI inflation reading, the price is expected to retrace to the 20,865–20,968 range, which corresponds to two key Fibonacci levels. The 20,968 level also aligns with a demand zone. Entry levels are: 20,865 (conservative) or more aggressive at 20,968. Before entering long, it is important to see confirmation of bullish pressure...
In terms of target, I think we will see new highs, but take profit partially and sistematically along the way..
Follow me to receive updates on this idea, including confirmations for entries, stop losses, and profit targets. Don’t miss out—hit that follow button now!

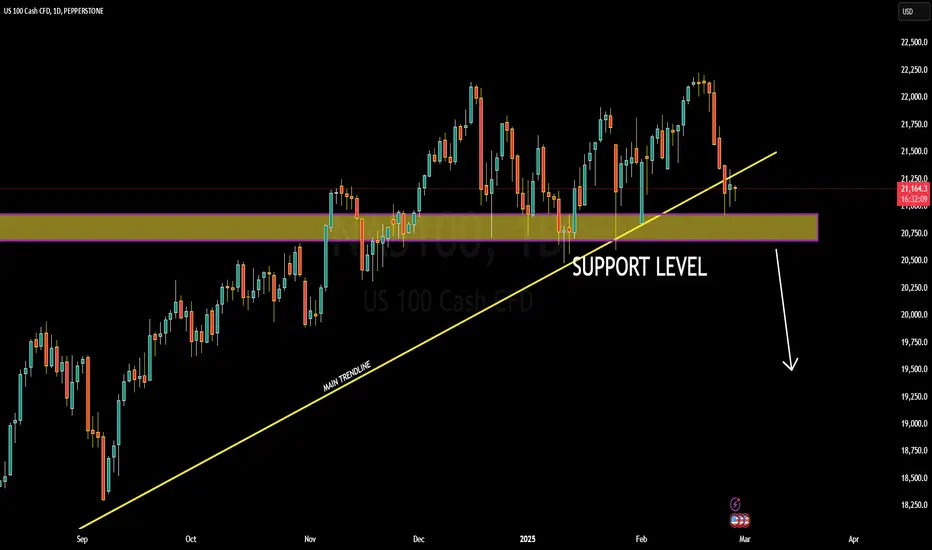
NAS100 at Critical SupportNAS100 is currently trading at 21,150, having completed a falling wedge breakout and now holding at a key support level. The falling wedge is typically a bullish pattern, but in this case, price action suggests a crucial test of support. If this level fails to hold, NAS100 could see significant downside momentum, potentially targeting the 19,000 level.
Technically, a breakdown below this support could confirm a bearish continuation, triggering a strong sell-off. Traders should watch for increased selling pressure and a sustained move below the support zone, which could accelerate bearish momentum. If the support holds, however, NAS100 could attempt a recovery, making this a decisive level to monitor.
Fundamentally, NAS100 remains under pressure due to concerns over Federal Reserve policy, interest rate expectations, and broader market sentiment. Any signs of prolonged high rates or weak earnings from major tech companies could fuel further downside pressure. Additionally, rising bond yields and a stronger US dollar may continue to weigh on the index.
In summary, NAS100 is at a critical support level after a falling wedge breakout, with the potential for a sharp drop if the support breaks. Traders should closely monitor price action, volume, and macroeconomic developments to confirm the next move. A break below this level could open the door for further downside toward 19,000.
What will nasdaq do? What will nasdaq do?
Truthfully I have no clue however based on technicals we have hit daily support. -
On the 1h we have a gap that needs to be filled at level 20,712.2 which is where I’m planning on entering if I see smt .let’s keep it simple !!
Also on the Vix we have reached resistance levels rejecting from 22.55 and possibly going to slap support if we get passed 17.50 to around 13.00 with that we should see very big pushes to the upside on Nasdaq . Last Friday was a pain however I got a good entry so I am looking to add to my position. Good luck

NSDQ100 oversold bounceback, The Week Ahead 03rd March '25The Nasdaq 100 (USTec) index maintains a bullish outlook, supported by its long-term uptrend. However, recent price action suggests a corrective pullback following the all-time high, bringing the index to a key technical support zone.
Bullish Scenario:
The 20280 level (200-day moving average) serves as a critical support zone, aligning with the long-term rising trendline.
A pullback towards this level, followed by a bullish bounce, could reaffirm the prevailing uptrend.
Upside targets include:
21200 (key resistance)
21450 (50-day moving average)
21620 (20-day moving average)
A strong rebound from 20280 could reinforce bullish momentum and set the stage for further gains.
Bearish Scenario:
A confirmed breakdown below 20280 with a daily close beneath this level would weaken the bullish structure.
This could trigger a deeper retracement, leading to downside targets at:
19990 (next key support)
19560, if bearish pressure intensifies
A sustained loss of 20280 may indicate a broader correction, potentially shifting sentiment in favor of sellers.
Market Outlook:
The 20280 level is pivotal—holding above this support will sustain the bullish trend, while a decisive break below it could signal extended downside risks. Traders should monitor price action and volume at this critical level to gauge the market’s next move.
This communication is for informational purposes only and should not be viewed as any form of recommendation as to a particular course of action or as investment advice. It is not intended as an offer or solicitation for the purchase or sale of any financial instrument or as an official confirmation of any transaction. Opinions, estimates and assumptions expressed herein are made as of the date of this communication and are subject to change without notice. This communication has been prepared based upon information, including market prices, data and other information, believed to be reliable; however, Trade Nation does not warrant its completeness or accuracy. All market prices and market data contained in or attached to this communication are indicative and subject to change without notice.


DownTrending Nasdaq is showing retracement from major support.DownTrending Nasdaq is showing retracement from major support.

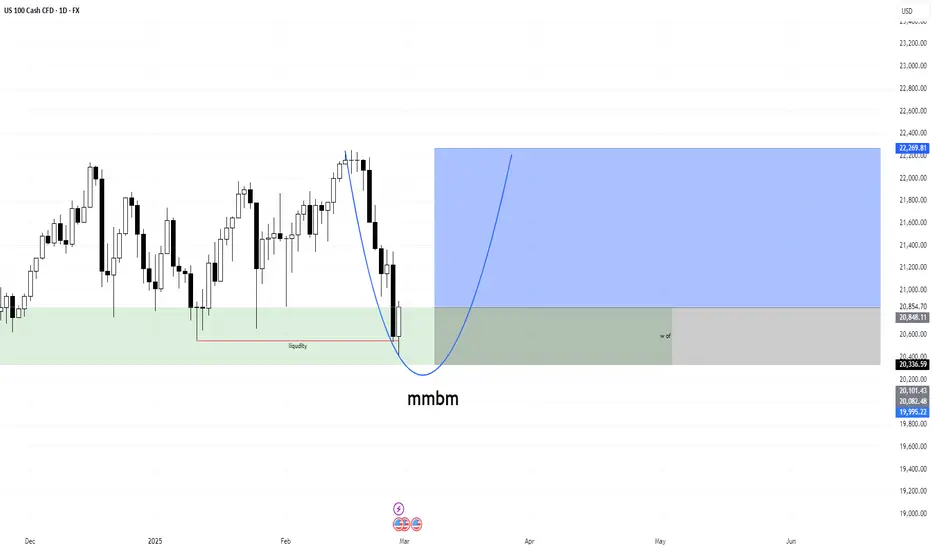
nas100 on playing mmbm nas100 bullish on next weeks
now reject on weekly oderflow and again reach in all time high in nas100
and its play in mmbm