TP FILLED ON NASDAQMinutes ago, I posted to sell NASDAQ targeting the 4H LQ, and the market filled our target.
Follow for more!
NAS100 trade ideas

NDXDon't be misled by sharp Monday declines; these are often manipulative moves rather than genuine market shifts. Historically, such drops are followed by recoveries, and indicators suggest this week aligns with that pattern. The Nasdaq Composite shows potential for upward movement through April, possibly extending into September. However, projections for 2027 indicate increased volatility and potential downturns. For now, positioning bullishly through Thursday seems prudent. 📈🚀

Nasdaq sceenario 25/02/2025English description:
After our macroeconomic analysis, we see that Nasdaq remains bearish, but there is potential for a correction. Therefore, we should wait for a clear confirmation before taking a short position.
Moroccan Darija description:
F l'analyse dyalna Macroeconomie kanchofo bli Nasdaq mazal fih lhbot mais kayna la possibilite dyal une correction apres ihbet dakchi 3lach antsana tban liya chi confirmation bana bach nakhod position short .
ATTENTION : I SHARE JUST MY IDEAS, NOT A SIGNELS

NAS100 BUY ANALYSIS SMART MONEY CONCEPT Here on Nad100 price has form a demand around area of 21489.99 which means that more buyers are likely to push the price up and trader should go for long with expect profit target of 21827.63 and 22176.51 . Use money management

US100 MARKET OUTLOOK Price may fall back to a pullback resistance of 20349.9 as we continue to see a sell pressure being exerted on lower timeframe prices. A buy opportunity is envisaged if we’d get a bounce off the pullback support level.

NAS100 Technical Analysis by TradingDONThe red box I marked highlights the area of squeezed liquidity. A bearish candle closing below it and the trendline will guide my focus towards the target of the 4hS purple box at 21.586. Let's embrace the challenge and strive for our goals!

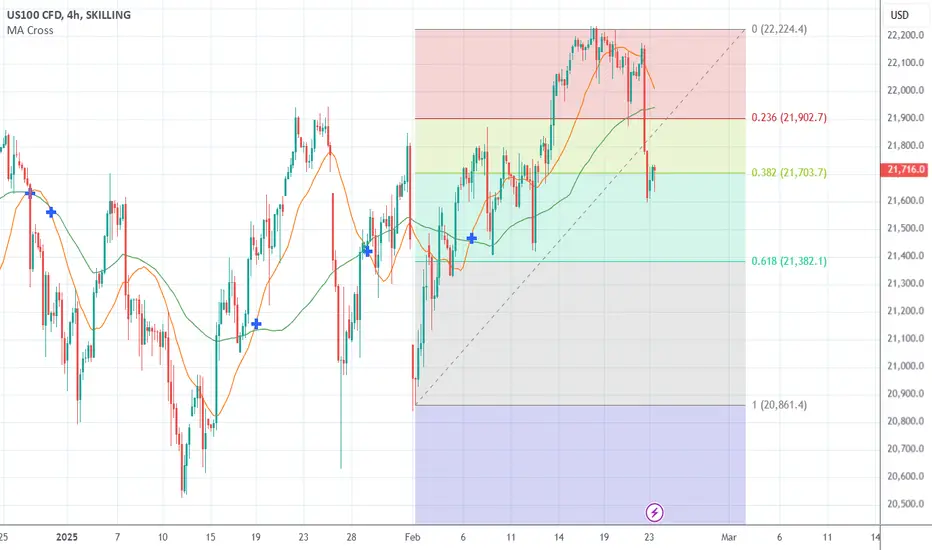
4-hr US100: 500-point Rally on the Horizon The NASDAQ 100 index is showing strong bullish momentum, as evidenced by the formation of a Golden Cross on the chart. This classic buy signal occurs when the short moving average crosses above the long term moving average, suggesting that upward momentum is gaining strength. This technical pattern is widely regarded as a confirmation of a continued uptrend, attracting more buyers into the market.
Currently, the price is testing a key support area around the 38% Fibonacci retracement level, a historically significant zone where buying interest has previously emerged. This provides a strategic opportunity to enter long positions, as the level may act as a springboard for further price appreciation.
We favor initiating buy positions at the current level, with a stop-loss placed below the 61% Fibonacci retracement to minimize downside risk. Our profit target is set just below 22,200, aiming to capture gains before potential resistance emerges. This setup ensures a favorable risk-reward ratio while aligning with the prevailing bullish trend.
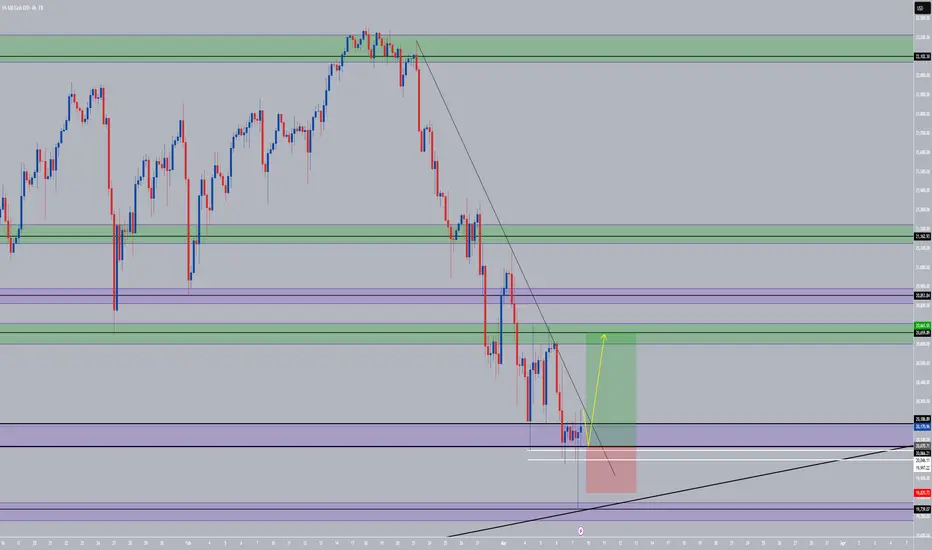
Possible push down for NAS100After A strong Bearish push, price action is filling the inefficiency left behind. Price is currently testing the structure lows previous support. The bearish move and retracement is the 78.6% PRZ
Wait for your lower time frame play to enter. This is an over all counter trend trade, however this could have a nice quick move down to retest the Daily previous structure high area of 21,843
Daily Chart has a Bearish Divergence that is playing out.
**Caution** on the macro bullish trend, this recent pull back retraced back to the 23.6 lvl with a wick while "retesting" the previous structure high on the H4 time frame....Enter with caution.

US100we've been bearish for some time but now price has reached a strong support zone. If H1 resistance is broken then we could have upward movement but if H4 support is broken then more downward movement. Lets see what price does.

NASQ 100 - Let's see if the price stands on daily supportHello traders, please feel free to share your trading ideas, and please give a Boost if you agree with my trading plan. My trading strategy is Price Action, which is the simplest strategy of trading on the price movement. A key part of my discipline is Stop Loss set when opening a trading position, which ensures every trading is risk managed. My 1 to 1 trading training is available, please message. Trade well and good luck!

NASDAQ H1 IdeaPotential for a bullish pullback on the NASDAQ H1 which could lead to a price movement towards the resistance level at 20500. BUY levels from 19900


Technical Analysis of NDQ100: Targets at $22,889.74!Analysis of the Nasdaq 100 Index (NDQ100) – 1W Chart
Hello TradingView Community,
I’d like to share my technical analysis of the NDQ100 on the weekly chart, based on historical price movements and Fibonacci retracements. The index is displaying a clear pattern that suggests a continuation of the uptrend following a correction. Here’s my outlook:
1. Upward Move to $22,889.74
The NDQ100 has seen a strong recovery since the low of approximately $5,692.32 (March 2020) and continues to show bullish momentum. Based on the Fibonacci extension (161.8%) from the last major correction (2022), the next significant target is $22,889.74. This level has been tested multiple times as resistance (see chart), and a breakout seems likely given the ongoing demand for tech stocks. The current price action also shows strong support from the 50-week EMA, which acts as a dynamic support level.
2. Correction of -34% to $15,087.06
Once the NDQ100 reaches $22,889.74, I anticipate a healthy correction. Historically, the Nasdaq has often experienced corrections of 30-40% after strong rallies (e.g., -34.17% in 2022). A -34% correction would bring the index down to approximately $15,087.06. This level aligns with the 38.2% Fibonacci retracement zone from the 2020-2025 rally and provides a strong support area, coinciding with previous consolidation zones (2023). Additionally, the 200-week EMA lies within this range, reinforcing it as a potential reversal point.
3. Rise of +121% to $32,923.00
Following the correction, I expect a new bullish wave. From $15,087.06, a +121% increase would take the NDQ100 to $32,923.00. This target is based on the Fibonacci extension (261.8%) of the entire uptrend since 2020, as well as historical patterns where the NDQ100 often reaches new all-time highs after corrections. The long-term trendline (marked on the chart) supports this outlook, as does the ongoing strength in the tech sector, driven by innovations in AI, cloud computing, and semiconductors.
Additional Indicators:
RSI (Weekly): The RSI is currently at 73.5, indicating potential overbought conditions. A pullback after reaching $22,889.74 would bring the RSI into a healthier range (around 50) before the next upward move begins.
Volume: Volume has increased during the recent rally, confirming the strength of the uptrend. A decline in volume during the correction would reflect a typical pattern for healthy consolidation.
Conclusion:
The NDQ100 exhibits a bullish long-term setup with an intermediate target at $22,889.74, followed by a -34% correction to $15,087.06. Afterward, I anticipate a strong rise of +121% to $32,923.00. This scenario offers both short-term trading opportunities (during the correction) and long-term investment potential. As always, keep an eye on macroeconomic factors such as interest rates and geopolitical developments, as these can significantly impact the tech sector.

NASDAQ a look ahead...As the NASDAQ and other major U.S. Equity Indexes face the pressure of economic uncertainty, the price action between days show that investors are not quite convinced this bull run has seen its finish line. However, we shouldn't only be looking toward private investor sentiment, but also that of the Federal Reserve's presence in the market and how the bond market reflects the Fed's position moving forward.
As shown here, the all time high for the TVC:NDQ is $22,133.22. Our position is that the NASDAQ must reclaim, retest, and continue beyond the all time high in order for us to continue our confirmation on the bull run. The path described should look as shown below...
In this instance, we can assume the bull run should continue. However, we should also be prepared for an alternate scenario where investors leave risk assets behind to chase non-risk assets (bonds for example). This scenario would look as shown below.
All though these are not the only two possible scenarios, we can most likely expect the future to play out in a similar fashion as the examples.
As for the market metrics to keep an eye on, look to TVC:US10Y for any bond yield manipulation, FRED:RRPONTSYD for market liquidity metrics, and FRED:M1V for M1 money velocity. Furthermore, keep an eye on tariffs for consumer tech ( NASDAQ:AAPL , NASDAQ:NVDA , NYSE:TSM ) and military activity ( NYSE:LMT , NYSE:RTX , NYSE:NOC ). Lastly, keep an eye on the banking and financial sector for more than likely banking deregulations withing the coming years.

NAS100 - Bullish Possibility- Resistance zone has push price down but price came right back up testing the resistence zone for the 3rd time... making the chances higher for price to break the resistence area this time.
- The downtrend line has been hit 3 times previously, Very high chances of a bullish break out on the 4th or 5th time.
- Last confirmation, as you look my analysis, you can see a double support in white. If price respect this support zone then it will give a great boost to push price right back up for a great bullish reaction.
* Educational purpose only

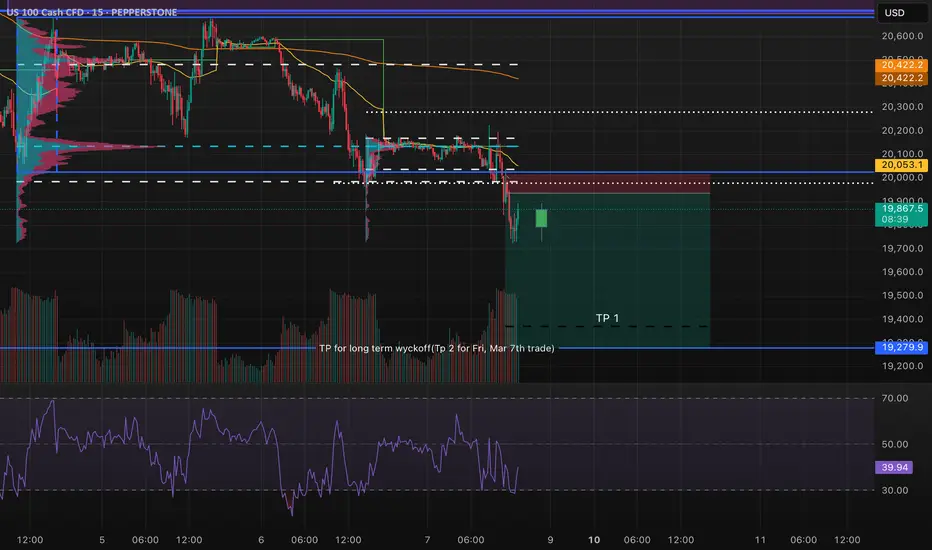
wyckoff pull back execution off 5min enter off the pull back off my the balance zone( distribution in this case). Tp is the closest vpoc
NASDAQ 100 Index ready to bounceNAS100 has now fallen -10% from its recent peak so officially a correction and has hit 200 day MA and RSI at levels where historically rebounds of 5%-10% over a month or so timeframe have typically happened.

Nasdaq 100 drops below 20K after NFP, but could it rebound?The Nasdaq and S&P 500 were testing their weekly lows after what has been a bruising last few session. But with both indices testing their respective key support areas, could we see a recovery from around the current levels, especially in light of a weaker US jobs report?
Keep an eye on the area around 20,000 on the Nasdaq, where the Trump rally commenced back in November. It is a key psychological area for the market. Can we see a bounce, or will the selling continue as we head deeper into the US session?
At the time of writing, the index was below this level, but the session is not over yet. In any case, a confirmed reversal on the lower time frames should be observed by traders looking to potentially buy this dip. For example, if the index recovers to go bac above yesterday's low of 20180, that would be a bullish sign in my view. But right now it is looking quite bleak.
By Fawad Razaqzada, market analyst with FOREX.com

NDX Last chance to buy.
Next legs before a great correction till 24000$, after summer.
Good luck with your investment.


NASDAQ CRASH BOTTOM PREDICTION 2025 (@nsarpi22) Prediction 2NASDAQ CRASH BOTTOM PREDICTION 2025
I expect Nasdaq to crash all the way down to the nearest monthly level based on my detailed analysis
NASDAQ CRASH BOTTOM PREDICTION 2025 2.0

NASDAQ CRASH BOTTOM PREDICTION 2025 (@nsarpi22)NASDAQ CRASH BOTTOM PREDICTION 2025
I expect Nasdaq to crash all the way down to the nearest monthly level based on my detailed analysis
