Indraday Update: NAS respecting bearish imbalance targetingWe have created yet another nearish imbalance range that price has used to continue to build short interest 🎯
Share with a friend in need of great levels 🔑
NAS100 trade ideas


Fair Value Gap @20300Price created a break of structure preceeded by a fair value gap, which was followed by a retracement to the order block where my buy limit was

NASDAQ 100 INTRADAY capped by 20600 resistanceBearish Scenario:
The intraday sentiment remains bearish, with recent price action suggesting a corrective pullback. If the index faces rejection at the key resistance level of 20,600, it could trigger renewed selling pressure. A downside move could target 20,000 as the first support level, with further declines extending toward 19,800 and potentially 19,660 if bearish momentum strengthens.
Bullish Scenario:
A breakout above 20,600 and a daily close higher would invalidate the bearish outlook, signaling a potential shift in momentum. If sustained buying pressure emerges, the index could rally toward the next resistance at 21,000, followed by 21,315 and 21,590 as upside targets.
Conclusion:
The 20,600 level is pivotal in determining the next directional move. A failure to break above this resistance reinforces the bearish outlook, while a decisive breakout could signal renewed bullish strength. Traders should monitor price action at this key level for confirmation of the prevailing trend.
This communication is for informational purposes only and should not be viewed as any form of recommendation as to a particular course of action or as investment advice. It is not intended as an offer or solicitation for the purchase or sale of any financial instrument or as an official confirmation of any transaction. Opinions, estimates and assumptions expressed herein are made as of the date of this communication and are subject to change without notice. This communication has been prepared based upon information, including market prices, data and other information, believed to be reliable; however, Trade Nation does not warrant its completeness or accuracy. All market prices and market data contained in or attached to this communication are indicative and subject to change without notice.

NAS100 | Reversal Incoming? Bulls Defending Key Support!📌 Tech Stocks Facing Pressure – Oversold Bounce?
🔸 The Nasdaq 100 has been in a strong downtrend, but price is now testing a major demand zone at 20,200 - 20,500.
🔸 Weakness has been driven by:
✅ Rising bond yields hurting growth stocks.
✅ Profit-taking after extended rallies in AI & tech.
✅ FOMC rate outlook uncertainty creating volatility.
💡 Upcoming Catalysts
🔹 The NFP report & Powell's speech will be crucial for short-term direction.
🔹 If inflation data remains high, rate cut expectations could be delayed → bearish for NAS100.
🔹 However, if bond yields cool off, tech stocks could see a strong relief rally.
🔍 Technical Analysis (1H Timeframe)
🚀 Key Levels & Market Structure
🔹 Demand Zone: $20,200 - $20,500 (Strong support)
🔹 Resistance Levels:
🔸 $21,126 – First upside target.
🔸 $21,901 – Major supply zone (potential reversal area).
📊 Possible Bullish Reversal Setup
📌 Price is testing a high-probability demand zone, suggesting buyer interest.
📌 If price breaks above $20,512, we could see a rally toward $21,126 & $21,900.
📌 Bullish confirmation if price closes above $20,600.
📈 Trade Plan
✅ Bullish Scenario
Buy near support if price shows rejection.
Target 1: $21,126
Target 2: $21,901
Invalidation: If price breaks below $20,200.
❌ Bearish Alternative
If price fails to hold above $20,200, expect a deeper correction.
🔥 Final Thoughts:
Nasdaq is at a critical support level – will bulls step in, or will sellers dominate? Comment below with your bias! 📉📈

Possible BUYAs the market looks to correct itself, Im looking at the 45m FVG that it has created. I would like for it to be 50% of the FVG and i will be taking buys from there to the previous highs.

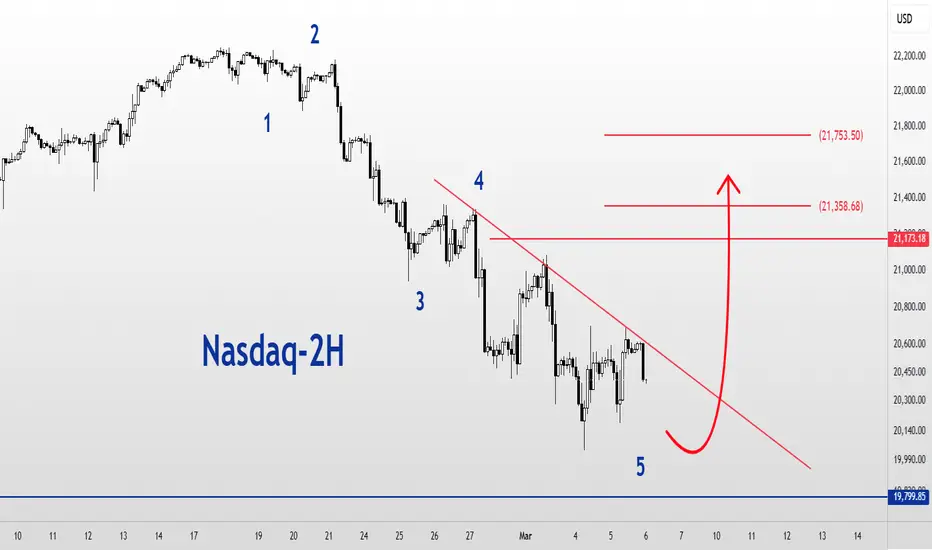
NASDAQ Index Analysis – Short & Mid-Term (Elliott Wave) According to Elliott Wave analysis, the NASDAQ index is still in a five-wave downtrend, and we are approaching the end of this bearish wave.
🔹 Key Level: If the price holds above 19,900, we can expect an upward wave.
🔹 Potential Upside Targets:
✅ 21,200
✅ 21,300
✅ 21,700
📊 A confirmed breakout above this level is crucial for a bullish move.
📌 What are your thoughts on NASDAQ’s next move? Share your insights with us! 💬🔍
Nas100 -SMCUS stock futures held steady after a volatile day of trading ended in a rally, driven by President Donald Trump's one-month pause on tariffs targeting automakers.
Futures attached to the Dow Jones Industrial Average (YM=F) slid hovered around the baseline and the benchmark S&P 500 (ES=F) slipped 0.1%. Futures attached to the tech-heavy Nasdaq (NQ=F) inched down 0.1%.

NAS100 - Trade SetupPrice action is looking good!
Here we are targeting Sell Side Liquidity and looking for an extension on the FIB aiming for 0.27 level. This looks to be out final leg of Elliots wave and will also finish our swing so It could be a nice opportunity to get into. Im selling at the 4H FVG which for confluence is within the OTE zone as well as a strong Supply zone.
Good luck to all the Traders that decide to follow

Nasdaq analysis: 06-MAR-2025Good morning, everyone! Today's Nasdaq analysis is designed to educate and empower. Use these insights to refine your price action trading strategy.

Long US100, NQ, NAS100 - Fundamental TraderLong, I have distributed my risk among these trades with proper risk management, my goal is to take some money home at end of the day, who cares about news/tarifs etc shit do...give me my money, trade to earn.
Use proper risk management
Looks like good trades.
Lets monitor.
Use proper risk management.
Disclaimer: only idea, not advice, trade on your own risk.

Reversal Month or Bearish ContinuationWe bounced off the Previous Month Low. Is the market reaching for the Previous Month High or will it break through PML and continue the Bearish Market?

US100 LONG above 20,400After SELL pressure from 2 weeks in FEB.2025, US100 find support at 20.200 (OPEN PRICE IN OCTOBER.2024), PRICE ACTION suggests LONG in short term before RESELL.
Looking for SELL later in 2 weeks.

NAS SELL Given the support levels and divergence in the price, I expect a return to the previous support level.

buy US100Buy entry after breaking resistance of price 20500. Target for take profit is 21850, this is the last high on 20 February 2025. This is also a resistance level for 26/12/2024 and 24/01/2025.

US100-bias short us100 is at the crucial MA 200 level support getting respected
fib level 0.5 getting respected with reaction
Bearish :
LLLH
Based on weekly time frame pair is making double bottom formation
Trend line support is broken.
As per the double tpp projection i can see the price can touch 19095
MA 21 is respected in weekly indicates further fall.
Next level can be at 19667-19095 based on fib level golden range.
Will look for short opportunities in this pair as i can see there its a failing IHS formation made .
Trade plan bias short @ 20376
SL:20582
TP1:20147
TP2:19913

NAS100 LOOKING SWEET, THINK BUY!Price is looking promising for a buy after price dropped back to a pullback support and currently trade at around the 200EMA I anticipate a new set of buyers to enter the market from the button low where it’s currently trading at. Expect a rise in price soonest! Start to accumulate positions now

Low Hanging Fruit ObjectiveNFP protocol. Low Hanging Fruit Objective. 1st Presented Fair Value Gap from Tuesday and Wednesday was used as support

Nadaq levels for intraday.Index trading is Best way to trade Zonal Levels. We need to see the trend to enter for long or short. Once the price is in trend, it will be in trend as long as it is not reversed in short term first. This chart provides you all the details that how someone can analyse the trend in best way.

Uncertainty is on the driver seat!Good day!
Yesterday close finally was not bullish; last hour saved the day if I may say!
Yesterday candle is the definition of uncertainty! Price closed below the key level of 20529 but above the weekly low.
- Fear of recession;
- Tax cuts;
- Tariffs and non-tariffs;
- Peace in Ukraine
No surprises from Trump speech... but we will hear from him daily!
Key data are coming.
My bias is still Sell. This said:
1- Good news or good data will send NQ to 21232;
2- Bad news or bad data will send NQ to 19620

Nas100 sudden crash heading towards which level?In this trade I am anticipating a downside movement in NAS100 based on recent price action. the market structure suggest that we are entering a little bit more of a bearish phase, and i am positioning for a move lower. MARKET BIAS:- The NAS100 is showing signs of weakening momentum and is likely heading towards downside. ENTRY POINT:- I've identified a favorable entry at current levels, where price action aligns with our analysis of resistance and key support zones. RISK REWARD RATIO:- 1.1:7 with proper risk management, this setup offers an excellent reward relative to the risk, making it a high-potential trade. ALWAYS REMEMBER TO MANAGE YOUR RISK AND USE STOPPLOSS ORDERS TO PROTECT YOUR CAPITAL.

NAS100 4-Hour Timeframe AnalysisNAS100 4-Hour Timeframe Analysis
The NAS100 index has recently shown significant bearish momentum following a period of consolidation. On the 4-hour timeframe, the price has consistently formed lower highs (LH) and lower lows (LL), indicating a prevailing downtrend.
A key technical area of interest is the 20,500 level, which previously acted as a major support zone. After a decisive breakdown, this level has now flipped into a major resistance. Notably, the price attempted a false breakout above this resistance, briefly trapping minor short sellers before reversing and gathering liquidity. This liquidity grab further strengthens the case for continued bearish pressure.
Following the rejection at the 20,500 zone, the price retraced to form a new lower high, reinforcing the bearish structure. With a clear breakdown below this major level and the accumulation of significant sell-side volume, we are closely monitoring the next phase of price action.
Our focus is on observing whether the price revisits the liquidity zone near 20,500 for another potential liquidity hunt. A sustained 4-hour candle close below this key level could provide confirmation of further downside momentum.
Key Technical Levels:
Major Resistance: 20,500 (previous support turned resistance)
Liquidity Zone: 20,480
Next Support Target: 19,630 (potential bearish objective)
Fundamental Insight:
Recent geopolitical developments may exert additional pressure on the NAS100. Former U.S. President Donald Trump's recent remarks regarding potential new tariffs on Chinese imports have introduced renewed uncertainty in the markets. His proposal for increased tariffs on Chinese goods could elevate tensions between the U.S. and China, heightening market volatility and weighing on equity indices like the NAS100.
Market participants remain cautious as these statements increase concerns about global trade disruptions, which could negatively impact technology-heavy indices. This broader economic uncertainty aligns with the technical bearish structure, reinforcing the potential for further downside if the price maintains below key resistance levels.
📌 Disclaimer:
This analysis is for informational and educational purposes only and should not be considered financial advice. Trading involves substantial risk, and past performance is not indicative of future results. Always conduct your own research and consult with a financial professional before making any investment decisions.

US100, NQ, NASDAQ Day trades Setup ReadyLong, I have distributed my risk among these trades with proper risk management, my goal is to take some money home at end of the day, who cares about tarifs and other shit...give me my money, trade to earn.
Use proper risk management
Looks like good trade.
Lets monitor.
Use proper risk management.
Disclaimer: only idea, not advice
