NASDAQ: Madness in the markets THANKS to Trump!! Watch out!!Investors are unwinding their risk positions in the face of the imminent escalation of the global trade war and are seeking refuge in the safest assets. The entry into force of the new US tariffs on Canada and Mexico of 25%, in addition to a doubling of China's taxes to 20%, has triggered falls in the stock markets.
The proposed tariffs represent the highest trade barriers in several decades, and their entry into force distorts supply chains and will increase the prices of capital goods, raw materials, industrial and consumer products, including food that crosses the border. Measures that will push inflation upwards.
---> How far can the price fall?
If we look at the chart above (DAILY timeframe), the price has touched a KEY zone where it could end the retracement phase if it respects it or, on the contrary, start a much deeper bearish phase.
Today it touched it and automatically rebounded, but we have to wait for it to consolidate and for the indicators to start marking a bullish TREND AND STRENGTH (Bull) in H4 and H1 timeframes. This Friday the NFP will be published and therefore it will be a key day in the markets.
If we look at the chart below (H1), the TREND is clearly bearish (Bear), and as long as we do not see a bullish TREND (Bull) in that chart, the end of the retracement cannot be considered finished.
--> What strategy can we follow?
If our PROFILE is AGGRESSIVE, we are in a very good area to enter long, but if our PROFILE is CONSERVATIVE, we should wait for the H1 or H4 timeframe chart to show an upward TREND and STRENGTH (Bull).
Conclusion:
Mr. TRUMP and his CRAZY way of attacking the WORLD, has BROKEN the markets and now we just need to see when he decides to back down and CALM the markets down again... because HE WILL DO IT!!! He is a MARKET MANIPULATOR and that is the problem (FOR EXAMPLE WHAT HE DID 2 DAYS AGO WITH THE CRYPTOCURRENCIES CARDANO, SOLANA AND RIPPLE). He uses his messages to manipulate everything and SOMEONE SHOULD STOP HIM... Warren Buffet might do it at any moment :-).
Greetings and good luck because we are in a difficult time to invest in a stable way.
NAS100 trade ideas

NAS100 BUY ANALYSIS POIHere on Nas100 price has made a be drop showing the seller stepping the market and has also forming a break of structure at down side but the buyers are likely to step in around area of 20114.78 support so trader should wait for price to touch around that zone before going to buy and target profit of about 21247.62 . Use money management

NASDAQ - Reversal ExpectedAttention, traders!
In the current sell-off we have very high values in the PCQ (put-call ratio on the NASDAQ)!
The stocks are trading above the highs that initiated a bullish reversal in August 2024, for example.
The following chart shows two potential targets for a long trade.

NASQ 100 - Has its revised pattern been created? Hello traders, please feel free to share your trading ideas, and please give a Boost if you agree with my trading plan. My trading strategy is Price Action, which is the simplest strategy of trading on the price movement. A key part of my discipline is Stop Loss set when opening a trading position, which ensures every trading is risk managed. My 1 to 1 trading training is available, please message. Trade well and good luck!

NAS & Indices are continuing to meltAll the indices are still seeking correction of inefficiencies existing in the sellside. There isn't much else to be said of this current situation until we start receiving bullish closes on higher time frame 4H/Daily.
Be sure to share this with a friend. I assure you this is trustworthy information and levels 🫡

BUY Trade for US100 15 Minute Time FrameBuy at Current Price: 20145
Stoploss: 20025
RP: 20265
R:R=1:1

POSITION REVERSED ON NASDAQWe reversed our position after that we got an IFVG to target the DLQ we have at 19785.48.

NASQ 100Hello traders, please feel free to share your trading ideas, and please give a Boost if you agree with my trading plan. My trading strategy is Price Action, which is the simplest strategy of trading on the price movement. A key part of my discipline is Stop Loss set when opening a trading position, which ensures every trading is risk managed. My 1 to 1 trading training is available, please message. Trade well and good luck!

NDX close to a tradable low?NDX has now pulled back roughly 10% in the space of the last couple of weeks and has hit the rising 200 daily MA. Also looks like a wave 4. We could be close to a tradable low.

BUY NASDAQI'm sharing with you our trade this morning on NASDAQ which is based on the FVG after the LQ grab, to target the BUYSIDE LIQUIDITY.
Follow for more!

NAS100USD Will Fall! Sell!
Here is our detailed technical review for NAS100USD.
Time Frame: 9h
Current Trend: Bearish
Sentiment: Overbought (based on 7-period RSI)
Forecast: Bearish
The market is approaching a significant resistance area 20,454.4.
Due to the fact that we see a positive bearish reaction from the underlined area, I strongly believe that sellers will manage to push the price all the way down to 19,860.0 level.
P.S
Please, note that an oversold/overbought condition can last for a long time, and therefore being oversold/overbought doesn't mean a price rally will come soon, or at all.
Like and subscribe and comment my ideas if you enjoy them!

NAS100 - How Overbought is NASDAQ ?How I see it:
I just felt it necessary to share the bigger picture.
1) NAS100 Has been overbought since JUNE 2023.
2) Price has broken a very significant 7 Month Bullish Trend a week ago.
3) Severe 1W TF Divergence!
Keynote:
I am not stating that NAS100 will fall all the way as indicated.
It is however very peculiar if you take your FIB from where the
divergence began @ 14050.00 up to the ATH @ 22237.00.
The indicated re-balancing of the divergence falls right between
71-79% retracement.
Thank you for taking the time to study my analysis.

Nasdaq market analysis: 04-Mar-2025Good morning, traders! Welcome to today's Nasdaq market analysis. Compare my price action insights with your own charts and enhance your trading skills.

Technical and digital analysisWe notice that we are in a price decline and there is an increase in momentum and we are in a small correction of the price decline

Long Idea at 1h Time Frame (US100)At one hour market is making HL.
market has touched fib level 0.618
Buy at cutrent price. (20719)
Stoploss at last HL. (20426)
R:R=1:1
TP: (21012)
_____
Market is now very close to SL you can enter here as well

NAS100 Bearish (Descending Trend, DOW LLs)NAS100 Unable to sustain above previous daily high. Overall indexes are seeing sell pressure with RISK ON instruments such as AUD and NZD showing sell off. Technically, bearish trend is not broken and DOW Lower Lows (LLs) still intact. Fundamentally Indexes will remain bearish.
Trade Setup:
Entry at Previous Day High (CMP)
SL at previous LH.
TP at 1:1 and 1:2
NasdaqMy technical analyse tell me we have a big chance to turn going back up, As we hope for the same from on our weekly fundamentals
NASQ 100 - see the pattern changes and open right position Hello traders, please feel free to share your trading ideas, and please give a Boost if you agree with my trading plan. My trading strategy is Price Action, which is the simplest strategy of trading on the price movement. A key part of my discipline is Stop Loss set when opening a trading position, which ensures every trading is risk managed. My 1 to 1 trading training is available, please message. Trade well and good luck!

Upcoming Monthly/Weekly Analysis!FA Analysis:
1- World economy and US economy are slowing down and the fear of recession is here. This time the recession will be caused by both demand and supply. The last one was supply-based.
2- US politics is the definition of self-destruction: tariffs; throwing under the bus Europe, Canada, Mexico and all historic allies.
3- Inflation is up.
All these factors are bad news for equities and NQ.
4- Tax cuts is what investors and corporations are looking to boost up stocks and equities.
5- Next FED might provide free money (the printing machine) to address/delay the recession.
6- This week, we have key data and events.
Good news is good news for equities and vice-versa.
TA Analysis:
Monthly TF:
The monthly candle was a red candle but not really a bearish candle as no break happened.
From strictly TA analysis, nothing to do until price breaks either direction. But based on FA, I see price moving down to at least 18000 (38.2 fib).
Weekly TF:
NQ provided a bearish weekly close. However, price did not confirm a change of structure. Hence, bearers need to break and close quickly below 20529 to continue the down movement. Otherwise, price must go back to retest and grab liquidity at 21702.
My bias is with a direct continuation down.
Daily TF:
At daily TF, we've two scenarios:
1- A meaningful retrace to 21702 as price was unable to close below 20529 to grab liquidity from the previous swing high (orange circles).
2- A shy retrace to reflect the battle between buyers and sellers and a continuation down.
That's all for this upcoming Month/Week.
Wish you green pips! GL!

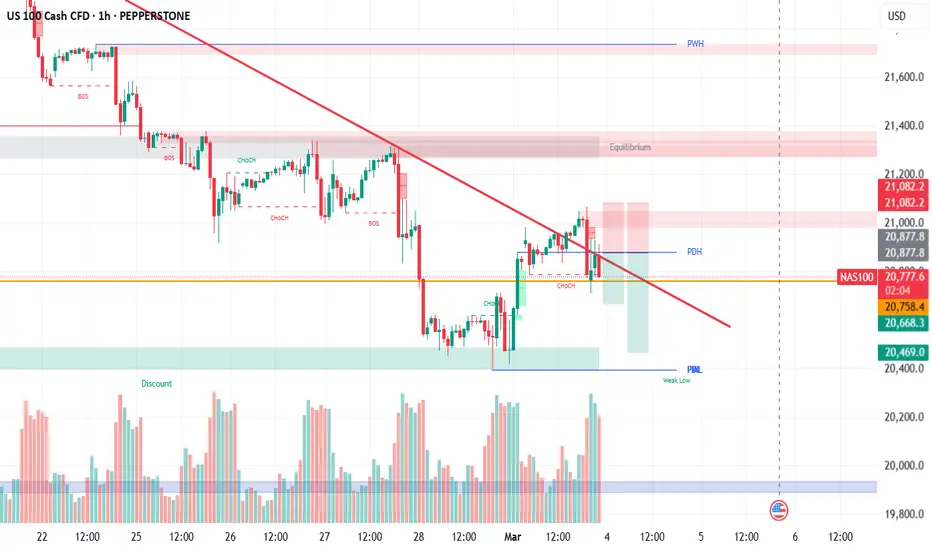
Smart Money Concept Analysis - USA100 (Nasdaq) 15 minThis analysis focuses on the USA100 index using Smart Money Concepts (SMC). Key areas highlighted include liquidity zones, order blocks (OBs), Break of Structure (BOS), and Change of Character (ChoCH). The goal is to map institutional footprints to identify high-probability trade setups for the upcoming trading week (March 4 to March 8, 2025).
This analysis is intended for day traders and intraday scalpers who prioritize precision entries and strong risk management.

$NAS100 approaching correction territoryWe are again back from a short winter flu. I think the index NASDAQ100 is also coughing showing signs of a flu. Pun indented. The tech heavy NASADQ100 does not look particularly healthy on a daily and weekly basis. In this weekly chart we can see that even if we find ourselves in the structural bull market the index has lost more than 5% from its peak. The internally also do not look good with MIL:MAG7 also bleeding and off their peaks. The PEPPERSTONE:NAS100 is almost approaching its 200-Day SMA. If the index loses another 3 % then it will land @ the 200 Day SMA which it @ 20200. In the upcoming weeks there are multiple events which might put pressure on the indexes. We have tariffs upcoming on Tuesday and we must watch out for the inflation and unemployment numbers.
But we must also look at the other side of the coin. A 10% pull back is normal in a secular bull market. In all the bull markets this kind of skittishness is normal. In my assessment PEPPERSTONE:NAS100 will be a good buy @ 200 Day SMA. My lowest level in this small correction phase is 19000 which is 0.618 Fib Retracement level on the upward sloping Fib channel I have plotted and an indicative of a secular bull market. I will keep visiting this chart in the future.
Accumulate PEPPERSTONE:NAS100 between 20200 and 19000.

More downside potential If the rebound remains below 21,617(Disclaimer: The following is only a personal opinion and not investment advice. Please make your own judgment before making any decisions.)
Last week, the price successfully broke below 21,436 on Monday, forming an overall bearish pattern. It subsequently reached the lower targets of 20,870, 20,648, and 20,549 in sequence, with the lowest close at 20,409. Although there was a rebound towards the end of Friday's session, it has not been sufficient to reverse the overall bearish trend.
Next week, I believe there is a high probability of further decline after a rebound. If this assumption holds, the price may experience intraday consolidation around 21,000 before breaking further upwards. If bearish forces dominate, the rebound should stay below 21,524–21,617, followed by another downtrend. The short-term downside targets are between 20,200 and 19,900.
If the price remains below 21,617, selling on rallies could be considered. However, if the price quickly breaks upwards, it is crucial to set a stop-loss in time.
For those looking to trade the rebound, short-term targets should be 21,016 and 21,115, with take-profit levels between 21,400 and 21,617. If the rebound scenario is valid, the price should not break below 20,221!
If the price breaks below 20,221 quickly on Monday or Tuesday, there may be no short-term rebound opportunity.
If bullish forces dominate next week, the price should break above 21,617 quickly and establish solid support above 21,000. In this scenario, the price should not drop below 20,221. The main upside targets are 21,617, 21,723, and 22,061 in sequence.

US100 (NASDAQ) - Potential Trend Reversal & Bullish Breakout SetMarket Outlook:
The US100 index has been in a strong downtrend, as seen in the descending channel (yellow). However, price action is showing early signs of a potential reversal, with a breakout from the bearish structure. This presents a high-probability bullish opportunity for traders.
Technical Analysis:
✅ Downtrend Channel Breakout: The index has moved out of the bearish structure, signaling a potential upside move.
✅ Key Support Zone: $20,200 - $20,250 has provided strong buying pressure, preventing further downside.
✅ Entry & Target: Price has broken out around $20,856, aiming for the $22,025 target, which aligns with key resistance.
✅ Bullish Momentum Confirmation: A move above $21,000 could further confirm the bullish reversal.
Trade Setup:
🔹 Entry Point: $20,856 (Active trade)
🔹 Target Level: $22,025
🔹 Stop Loss: Below $20,236 (Support zone)
🔹 Risk/Reward Ratio: Favorable setup
Fundamental Factors to Watch:
Tech Sector Performance: The US100 is heavily influenced by tech stocks, and any bullish sentiment in the sector could push the index higher.
Economic Data Releases: Watch for upcoming job reports, inflation data, and Fed comments that could impact price action.
Market Sentiment: If broader indices show strength, expect bullish continuation.
Conclusion:
The US100 is in an active bullish setup, with a breakout from the downtrend. If momentum sustains, we could see $22,025 tested soon. Traders should monitor price action around resistance for confirmation of further upside.
📌 Bullish breakout in play! Keep an eye on market conditions and manage risk effectively! 🚀
