Algorand (ALGO/USD) 4-Hour Chart: Price Action Analysis
Title: Algorand (ALGO/USD) 4-Hour Chart: Price Action Analysis and Key Structural Shifts
Post:
A thorough analysis of Algorand's 4-hour chart reveals a significant transformation in market sentiment, marked by key structural changes at pivotal price levels. Here's an in-depth exploration of the price action structure theory about this chart:
Trend Transition: Initially, Algorand was on an upward trajectory, as evidenced by a series of ascending highs and lows. However, a critical level of around 0.4670 USD emerged as a decisive point, where the sentiment shifted from bullish to bearish. This level's repeated testing highlights its role as a crucial psychological and technical barrier.
Change of Character (CHoCH): The chart highlights a significant "Change of Character" moment, labeled as "CHoCH". This event signifies when the price forcefully broke below-established support levels, marking a clear transition of control from buyers to sellers.
Formation of a Downward Channel: After experiencing the CHoCH, Algorand's price action subsequently formed a descending channel, marked by two parallel trendlines. This structure represents a bearish phase, characterized by the consistent formation of lower highs and lows, reflecting ongoing selling pressure.
Retesting Key Levels: The price has recently retested the level around 0.4667 USD, which it had broken through previously. Now serving as resistance, this level reminds the market of its former role as support. The inability to surpass this point, followed by a decline, solidifies the current bearish sentiment within the channel.
Current Market Dynamics: Post-test, the price has resumed its downward path, sticking closely to the upper boundary of the channel. This behavior indicates that sellers are still dominant, potentially guiding the price towards or even beyond the channel's lower boundary, depending on broader market dynamics.
Key Level Insight: An essential level to watch is approximately 0.4703 USD, the 4-hour RSI high, acting as a significant resistance during recent price actions. Additionally, the 4-hour "closed" low at 0.3858 USD and the "low" at 0.35 USD, which was a 50% retracement from the local top, along with some support around 0.4230 USD.
Future Market Outlook: Traders should stay alert for signs of either a continuation of the current downtrend or a potential breakout. A break above the channel's upper boundary could signal a shift back to bullish conditions, while a move below the lower boundary might indicate a deepening of the bearish trend. Notably, the RSI has reset and confirmed a new low, suggesting watching for a break from the established lower high or low structure.
ALGOUSD.P trade ideas

Algorand / USD | Chart & Forecast SummaryKey Indicators On Trade Set Up In General
1. Push Set Up
2. Range Set up
3. Break & Retest Set Up
Notes On Session
# Algorand / USD
- Double Formation
* 0.1650 USD Support Area | Break Out | Subdivision 1
* 012345 | Wave 3)) Ongoing
- Triple Formation
* Pennant Structure At 0.3110 USD | Subdivision 2
* Neckline | Bottom Structure At 0.5000 USD | Subdivision 3
* Trend, Behaviour & Entry
Active Sessions On Relevant Range & Elemented Probabilities;
London(Upwards) - NYC(Downwards)
Conclusion | Trade Plan Execution & Risk Management On Demand;
Overall Consensus | Buy

ALGO Update Lower Time FrameThis is just a zoomed in version of my previous chart to show the lower time frame analysis that I am tracking at the moment. Wave counts are always difficult I think when price is moving so impulsively. However, the most obvious move in all of it is this recent downside flush, which has created a perfect ABC correction. These almost always mark the end of a wave 1 and this is why I have concluded we are in wave 2 of 3 of this impulsive move. My upside target for the end of this run up (which I think is a wave 3 of 5) is somewhere between $5 and $10, with some bumps along the way. My wave count beyond existing price action is purely speculative at present and will likely change...

Is ALGO finished consolidating?Yes, with ALGO we can expect it to feel like it suddenly moons, as this is typical. Historically, ALGO's prices have fluctuated heavily as it climbs so if you are a holder theres nothing to worry about on those dips that we just went through.
You'll see well continue climbing this linreg channel on the 4 hour.
It will continue its steady incline to $1 and then $2. No TA needed there just look at the previous bull runs
For now I'm heading to another traders house for beers and I expect to see at least $0.52 ALGO while sipping them.

ALGO UpdateThere are many ways to interpret this chart but I am viewing it as a high time frame ABC from the launch price, which is extremely bullish long-term. Given that Algorand is currently a key part of the planned quantum financial system, together with XLM, XRP, IOTA and XDC (all the biggest gainers in this recent run up), I think this is the most likely interpretation. Price has just broken above the B wave of the larger C wave and this is the first sign of reversal. The purple box is the expected consolidation zone before a move up to all time highs, with $1.844 being a likely minor resistance along the way. Looking at the recent move from a Wyckoff perspective, we have had the spring, retest and now price is probably at the last point of supply. The sell off has priced in an ABC from the all time lows, reaching the 1.236 extension of a possible A wave but I think this is likely a shakeout to cast doubt on the bullish hypothesis.

Hidden 4HR Bull Div $ALGO
Hidden Bull Div, New low on the 4hr RSI = RSI reset to make a new High. Bullish!!!

ALGORAND can go up to (+92%)Algorand is showing good stregnth in the monthly and weekly timeframe with a possibility of +92% increase. Staying above $0,46 and above the vwap from 2021 would indicate a reach for higher prices, the target is apr/mar 2022 highs alongside with monthly level, fibonacci levels and the last bull run value area low/point of control.

ALGO...was that a sonic boom?Watch it soar. Monthly chart and I like the $1.30 range for next serious pullback. Only adding new money

Sell pressure on Algorand! Oh well, we are gonna see some panic sells in this week. Let them leave the market, so that we can go ATH on this shit!

Algo/USD Fib targetsThe current chart shows the most important Fibonacci targets.
Grey: Resistance/support, decisive prices. A dump/pump can happen at these levels, but is not a main target
Red: Main target to take profits or potentially enter shorts
Green: Buy or rebounce expected
Red box: resitance are, mainly caused by the 1.618-1.65 fib level
Green box: Support level, mainly 0.618-0.65 fib
Breaking each target gets us to the next one.

ALGO/USD: Bullish Momentum with Impulse EdgeThis analysis highlights Algorand's (ALGO/USD) bullish performance using the Dynamic Opening Range Breakout and Impulse Edge Detector. Multiple "BUY" signals showcase strong momentum, and the breakout above key levels confirms the uptrend. With volume increasing steadily, this could indicate continued strength. Thoughts on the next move?

Algorand almost already to full invh&s breakout targetThe golden cross strikes again with an immediate blast off in algorand price as it is already getting very close to hitting the full inverse head and shoulder breakout target here. Zooming in here we ca more clearly see how the golden cross coincided with this blast off: *not financial advice*

Algorand (ALGO) Market AnalysisCurrent Market Conditions
As of December 2, 2024, Algorand (ALGO) is trading at approximately $0.48 USD, with a 24-hour trading volume of $1.96 billion USD. The cryptocurrency market is experiencing a period of moderate volatility.
Technical Analysis:
The ALGO/USDT chart is showing a potential breakout scenario. The price is currently consolidating below the 0.236 Fibonacci retracement level, which is acting as a resistance. A successful break above this level could trigger a significant price increase.
Key Levels to Watch:
- Resistance: 0.236 Fibonacci retracement level (approximately $0.53 USD)
- Support: 0.382 Fibonacci retracement level (approximately $0.38 USD)
- ATH: $3.28 USD (reached on June 21, 2019)
Market Sentiment:
The overall market sentiment for ALGO is bullish, with many traders and investors expecting a breakout above the 0.236 Fibonacci retracement level. A successful break could lead to a significant price increase, potentially reaching the ATH.
Trading Strategy:
- Long-term investors: Consider accumulating ALGO on dips, with a target price of $3.28 USD (ATH).
- Short-term traders: Watch for a breakout above the 0.236 Fibonacci retracement level (approximately $0.53 USD). If successful, consider entering a long position with a target price of $1.50 USD.
Risk Management
- Set stop-loss orders below the 0.382 Fibonacci retracement level (approximately $0.38 USD) to limit potential losses.
- Consider scaling into positions to manage risk and maximize potential gains.
By closely monitoring the ALGO/USDT chart and watching for a breakout above the 0.236 Fibonacci retracement level, traders and investors can potentially capitalize on a significant price increase and reach the ATH.

Algo possibly to 1$Algorand has finally caught an upward spike after being rather stable at its lowest value for close to 2 years.
In the current Alt market, people are looking for:
- Relatively small market cap
- Previous ATH to be much higher than current value
- A long stable bottom, but a good sign of upwards potential
Algo was tricky for a long time, skipping most of the upwards trend so far until now, exploding with a big move. This can also be worrisome as a correction usually follows big moves like this. Here is why I dont think a correction will actually follow:
- Trading volumes are mostly for buys above the 0.30$ mark
- Most volume was between 0.37-0.47, with a lot of selling happening there
It does seem like most people are just getting on the ride.
Things to be careful about:
- Algorand does not have the same amount of currency in circulation now as it did back in 2022
2022: 6.95B
2024: 8.3B
Which does mean that its nearing its full amount of market cap/currencies in circulation, but people have been staking Algo for a few years now and receiving Algo according to the release schedule. I expect people to partially sell as Algo hits the 0.70$ and the 1$ marks.
If you plan to hold Algo long term, careful not to buy too much above those numbers for now, as a large correction will be very likely.
Its not at all unlikely that Algo can print an ATH during this run, lets see what December brings us.
Good luck trading, and don't forget to place targets and stop losses.
And remember, this is not a financial advise, trade at your own risk.

ALGO LongALGO at a cross-roads? This is a monthly chart that's 1.5 hours old. I expect it to challenge the old trendline area. This is crypto though so charting is only guessing. I think up is our real direction. Likely buy $100 more if drop below $0.40. If not, have my bags and ready to ride. Stake much?

ALGO, the best ALT coin to hold? Yes! It's time for a FREE RUN! As expected ALGO is pushing and is not going to stop before $2.5!

Goldencross Once Again Having Immediate Impact;On Algo This TimeSo far my hypothesis that the golden cross responds immediately in the parabolic phase of the bull run is continuing to be proven correct as we see it happening again here now with algorand. Sending price already skyrocketing almost to the full inverse head and shoulders breakout target at .5050 *not financial advice*

Algorand mark up phase (Part 2)This is an addition to the ongoing macro trade idea from the spring phase low.
This whole structure here, looks to me like one long wyckoff accumulation campaign and Adam / Eve double bottom.
This is your sign of strength, and the expectation is to return to the range high, and likely see a partial decline or consolidation once achieved.
If i am correct here, we could expect eventual targets at the 100% measured move of the range, confluent with both the 1.618 extension of the spring correction, and a 4.236 of wave 1 coming up.
This is a weekly chart, this will take time and itll probably be a difficult hold, but if it continues to play out in this fashion, that will be my expectation until proven otherwise.

ALGOWish I bought way more! Watching next resistance line then WE off again. Bull runs we only buy pullbacks. Anything above 10% from most recent high is a gift.

ALGO Running out of steam for now.Looks we're topping the MACD for Friday 29th, It will cool off over the weekend then Monday go again from the low 33 range.
Volume is also picking up over the last week.

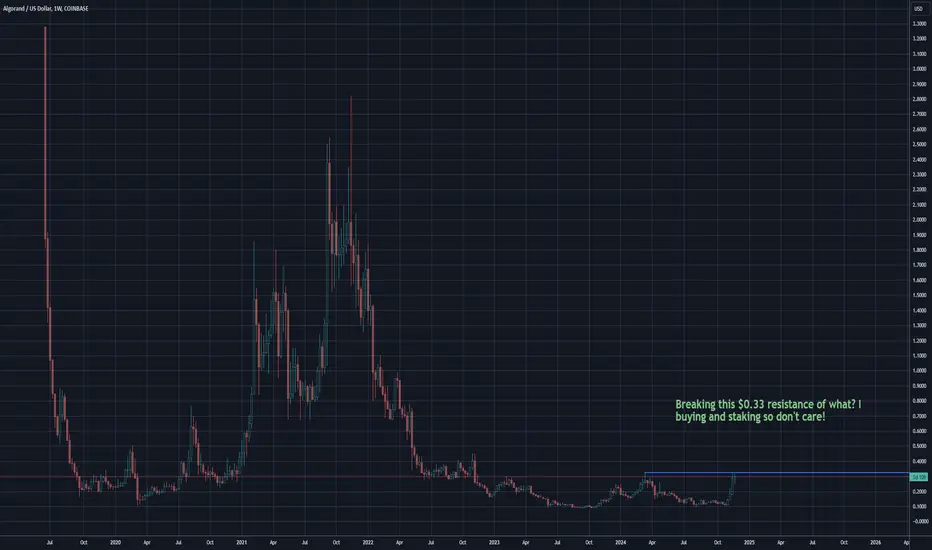
ALGO weekly primed for a move!The weekly price action for EURONEXT:ALGO looks great. Close to breakout of $0.33 range. Will be buying more for staking purposes. Like to govern this stuff not just trade for crappy $USD! HODL or whatever you want to call it.
ALGO long term viewBullish long term view for Algo. Following suite of other Alt coins. A lot of upside potential for these coins in 2025. Both technically and fundamentally with Trump being president and supporting cyrpto in general. Big year for these coins coming up

Algorand Current Market StructureGood Day Fellow Traders
The ALGO chart is currently exhibiting a short-term ABCD pattern, indicating a potential reversal or continuation. Throughout the last week, ALGO has demonstrated impressive gains, suggesting a robust bullish momentum.
Support and Double Bottom Confirmation
ALGO has found significant support at the $0.25 level, which is confirmed by a double bottom pattern. This support level serves as a crucial foundation for the potential bullish continuation.
ABCD Pattern and Point D Projection
The ABCD pattern suggests that ALGO might be cooling off temporarily before resuming its upward trajectory. If the pattern plays out, we can expect ALGO to reach Point D, which could mark the beginning of another bullish leg.
Bullish Continuation and Potential ATH
Upon reaching Point D, ALGO may experience a bullish resurgence, potentially leading to new all-time highs (ATH). The double bottom confirmation and the ABCD pattern suggest that ALGO is poised for a continuation of its uptrend.
Conclusion
In conclusion, the Algorand chart is exhibiting a short-term ABCD pattern, indicating a potential bullish continuation. The double bottom confirmation at $0.25 provides a solid support level, and reaching Point D could mark the beginning of another upward leg. As ALGO cools off temporarily, it may be preparing for a more significant bullish move, potentially leading to new all-time highs.
