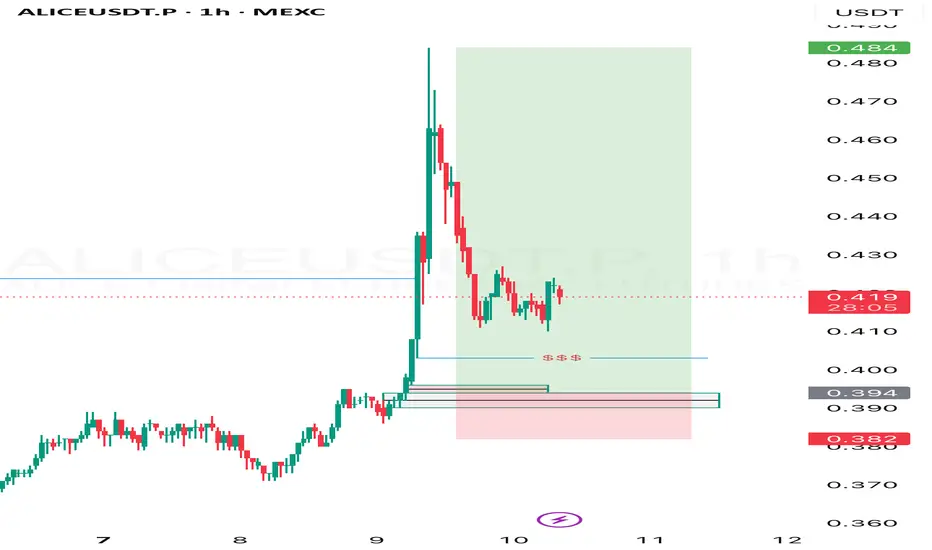
ALICEUSDT | Bullish Reversal After Liquidity Sweep + S&D FlipPrice action formed equal lows ($$$), creating a liquidity pool below the consolidation. After a sharp bullish move (potential manipulation), price reversed and aggressively swept those lows, tapping into a clear 1H demand zone.
This move grabbed liquidity and filled the imbalance (FVG) before showing a strong bullish rejection. The sharp recovery indicates potential accumulation and a possible smart money re-entry.
We now have:
• ✅ Liquidity Sweep (equal lows taken out)
• ✅ 1H Fair Value Gap + Demand zone confluence
• ✅ Strong bullish engulfing from POI
• ✅ Market Structure shift (break above local structure)
• ✅ S&D Flip – previous supply now acting as support
⸻
Entry & Management:
• Entry: Inside demand zone ($0.394)
• Stop-Loss: Below demand and liquidity grab ($0.382)
• Targets:
• TP1: $0.435 (local high)
• TP2: $0.460 (imbalance fill)
• TP3: $0.480 (next liquidity target)
⸻
Conclusion:
This trade aligns with Smart Money Concepts – we had a textbook liquidity inducement into a refined POI, followed by a market structure shift and clean rejection. As long as price holds above the flipped zone and demand, the bullish scenario remains valid.
📌 Risk-to-reward is favorable; invalidation is clear. Waiting for further confirmation on the 15M for scaling in or adding size.
ALICEUSDT trade ideas
ALICE ( SPOT)BINANCE:ALICEUSDT
#ALICE/ USDT
Entry range (0.38- 0.41)
**** Wait for the price to come to the entry range ****
SL 4H close below 0.36
T1 0.5170
T2 0.5700
T3 0.6100
T4 0.6800
**** Wait for the price to come to the entry range ****
_______________________________________________________
Golden Advices.
********************
* collect the coin slowly in the entry range.
* Please calculate your losses before the entry.
* Do not enter any trade you find it not suitable for you.
* No FOMO - No Rush , it is a long journey.

#ALICE/USDT Ready to go higher#ALICE
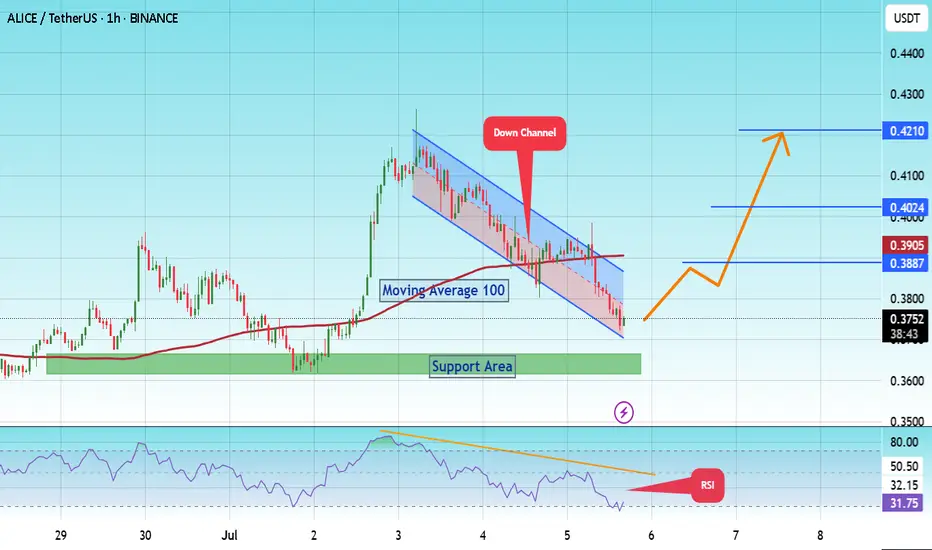
The price is moving within a descending channel on the 1-hour frame and is expected to break and continue upward.
We have a trend to stabilize above the 100 moving average once again.
We have a downtrend on the RSI indicator that supports the upward break.
We have a support area at the lower boundary of the channel at 0.3700, acting as strong support from which the price can rebound.
We have a major support area in green that pushed the price higher at 0.3632.
Entry price: 0.3753.
First target: 0.3887.
Second target: 0.4024.
Third target: 0.4210.
To manage risk, don't forget stop loss and capital management.
When you reach the first target, save some profits and then change the stop order to an entry order.
For inquiries, please comment.
Thank you.
ALICE/USDT: Searching for the Bottom. Growth Prospects."The chart shows a clear key area — a “core zone” that keeps attracting price action.
Price reacts to it repeatedly — sometimes bouncing from below, sometimes rejecting from above.
Now we’re seeing another retest with potential upside.
🟡 Trading near the mid-range is the simplest approach.
Entry from the current level is possible, but there’s still a chance of filling the lower channel zone around $0.12–$0.18 — depends on your risk strategy.
⚠️ Risk management note:
For altcoins like this, it’s better to size positions small — ideally 1–3% of your capital, or even less.
🎯 First major target: the upper channel zone at $0.77–$1.03

#ALICE/USDT#ALICE
The price is moving within a descending channel on the 1-hour frame, adhering well to it, and is on its way to breaking it strongly upwards and retesting it.
We are seeing a bounce from the lower boundary of the descending channel, which is support at 0.4560.
We have a downtrend on the RSI indicator that is about to break and retest, supporting the upward trend.
We are looking for stability above the 100 moving average.
Entry price: 0.4835
First target: 0.5028
Second target: 0.5263
Third target: 0.5533

ALICE Looks Bearish (4H)The ALICE structure is bearish. It has been rejected from premium zones and a bearish internal CHoCH has also formed.
A move from the identified supply zone toward the demand zone is expected.
A daily candle close above the invalidation level would invalidate this analysis.
Do not enter the position without capital management and stop setting
Comment if you have any questions
thank you

ALICEUSDT UPDATE
ALICE/USDT Technical Setup
Pattern: Falling Wedge Breakout
Current Price: $0.494
Target Price: $1.20
Target % Gain: 170.08%
Technical Analysis: ALICE has broken out of a falling wedge on the 1D chart, showing early signs of reversal. The breakout is accompanied by a strong green candle, confirming bullish momentum.
Time Frame: 1D
Risk Management Tip: Always use proper risk management.

ALICEUSDT 1D AnalysisALICE ~ 1D Analysis
#ALICE Currently it comes out of this declining zone. Maybe this support block you can consider to start buying back from here with a short -term target of at least 10%+.

We are witnessing the attack of the bulls on Alice's neighbor. In the medium term, and given the movement of Bitcoin, if there is no severe crash in the market, Alice can reach the specified range. However, this is what I think about and shared, so there is no reason for you to use it. I hope you do not come out of this market empty-handed.

#ALICE/USDT#ALICE
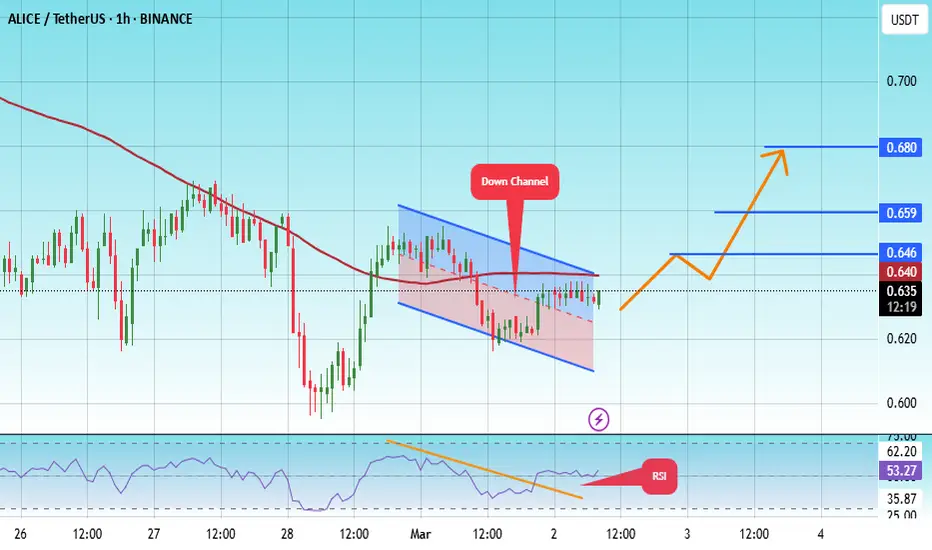
The price is moving in a descending channel on the 1-hour frame and is adhering to it well and is heading to break it strongly upwards and retest it
We have a bounce from the lower limit of the descending channel, this support is at a price of 0.615
We have a downtrend on the RSI indicator that is about to break and retest, which supports the rise
We have a trend to stabilize above the moving average 100
Entry price 0635
First target 0.646
Second target 0.660
Third target 0.680
ALICEUSDT 5DALICE ~ 5D Analysis
#ALICE Test this support block. Buy from here if you still have a Conviction on this coin with a minimum target of 20%+.

ALICE UPDATEHow are you my friends?
I warned against falling to this level and below in the previous post you can see it on my page
Today we actually see the 0.86 level
Now we will see again a rise from these areas which are considered good as I told you last time about the fall to the accumulation areas
These areas are ideal areas for buying pay attention to the confirmed rise and do not worry about further decline
A temporary period as we realized the fall previously and now we confirm the rise again

ALICE AnalysisWe can see more decline but this is temporary
We can see more decline but the trend is still up and the targets are very big
But it is better to be aware of the entry points from the 0.96 area and any other decline you can strengthen by buying and maintain your buying positions without worry
The targets are investment and not quick speculation

#ALICE/USDT Ready to go higher#ALICE
The price is moving in a descending channel on the 1-hour frame and sticking to it well
We have a bounce from the lower limit of the descending channel, this support is at 1.08
We have a downtrend on the RSI indicator that is about to break, which supports the rise
We have a trend to stabilize above the moving average 100
Entry price 1.18
First target 1.22
Second target 1.264
Third target 1.325

#ALICE (SPOT) entry ( 0.940- 1.140) T.(4.600) SL(0.849)BINANCE:ALICEUSDT
#ALICE / USDT
Entry ( 0.940- 1.140)
SL 1D close below 0.849
T1 1.450
T2 2.600
T3 3.400
T4 4.600
1 Extra Targets(optional) in chart, if you like to continue in the trade with making stoploss very high.
______________________________________________________________
Golden Advices.
********************
* collect the coin slowly in the entry range.
* Please calculate your losses before the entry.
* Do not enter any trade you find it not suitable for you.
* No FOMO - No Rush , it is a long journey.
Useful Tags.
****************
My total posts
www.tradingview.com
1Million Journey
www.tradingview.com
www.tradingview.com
**********************************************************************************************
#Manta #OMNI #DYM #AI #IO #XAI #ACE #NFP #RAD #WLD #ORDI #BLUR #SUI #VOXEL #AEVO #VITE #APE #RDNT #FLUX #NMR #VANRY #TRB #HBAR #DGB #XEC #ERN #ALT #IO #ACA #HIVE #ASTR #ARDR #PIXEL #LTO #AERGO #SCRT #ATA #HOOK #FLOW #KSM #HFT #MINA #DATA #SC #JOE #RDNT #IQ #CFX #BICO #CTSI #KMD #FXS #DEGO #FORTH #AST #PORTAL #CYBER #RIF #ENJ #ZIL #APT #GALA #STEEM #ONE #LINK #NTRN #COTI #RENDER #ICX #IMX #ALICE #PYR #PORTAL #GRT #GMT #IDEX #NEAR #ICP #ETH #QTUM #VET #QNT #API3 #BURGER #MOVR #SKL #BAND #ETHFI #SAND #IOTX #T #GTC #PDA #GMX #REZ #DUSK #BNX #SPELL #POWR #JOE #TIA #TFUEL

#ALICE (SPOT) entry range( 0.870- 1.040) T.((1.980) SL(0.849)BINANCE:ALICEUSDT
entry range ( 0.870- 1.040)
Target (1.980)
SL .1D close below (0.849)
*** collect the coin slowly in the entry range ***
*** No FOMO - No Rush , it is a long journey ***
**** #Manta ,#OMNI, #DYM, #AI, #IO, #XAI , #ACE #NFP #RAD #WLD #ORDI #BLUR #SUI #Voxel #AEVO #VITE #APE #RDNT #FLUX #NMR #VANRY #TRB #HBAR #DGB #XEC #ERN #ALT #IO #ACA #HIVE #ASTR #ARDR #PIXEL #LTO #AERGO #SCRT #ATA #HOOK #FLOW #KSM #HFT #MINA #DATA #SC #JOE #RDNT #IQ #CFX #BICO #CTSI #KMD #FXS #DEGO #FORTH # AST #PORTAL #CYBER #RIF #ENJ #ZIL #APT #GALA #STEEM #ONE #LINK #NTRN #COTI #RENDER #ICX #IMX #ALICE ****

ALICE Long Trade Plan
▶️In my primary count, we're currently in green IV of blue C.
▶️I expect another lower low to finish green V / blue C.
▶️A fakeout from the gray ascending trendline with RSI divergence will be my trigger for a long trade.

ALICEUSDT 1WALICE ~ 1W
#ALICE This is an important support block on this coin. If you still have Conviction on this coin,. This support block would be a very good buying place for now. Buy gradually within this support block.

ALICE How Can i Fade ThisALICE still holding support trendline when another coin breakout trendline
This is insane when ALICE also pullback here
But this movement placed ALICE below redline
I think we are consolidation here before next moving
Or maybe testing another support to manipulate price before next leg

ALICEUSDT 1WALICE ~ 1W
#ALICE If you still have Conviction on this coin. Buy in increments within this block. The downtrend on this coin has ended. bulls will dominate from here. Minimum target 20%+

Alice H&S?The only thing i could make of this chart is a realy chaotic h&s pattern with a technical target to some backtest to the upside. Dont see a nice count or anything. Tell me what you think

Alice Making Bullish Set upI hope, this will be surely triggered my entry zone and going up smoothly SL and TP is always mentioned

ALICEUSDTWe are building the left shoulder for a sweet flight...
Usually, waiting for the optimal entry is an exciting period. Political risks have not left the market yet, so the best time to build the infrastructure of a safe house is now.
