SEE THIS BEFORE TAKING ANY LONG POSITION! ALTPERP UPDATE!!Hello everyone, if you like the idea, do not forget to support with a like and follow.
Welcome to this ALTPERP update.
Here is the 3hr chart of Altperp. Altperp is a index which we can use while we trade in futures Altcoins.
As you see in the chart, Altperp is retesting the symmetrical triangle after the breakdown. After this successfully retest we can expect a drop in this index so we can see drop in Altcoins too.
So imo it's a bit risky to taking a long position here.
Invalidation level:- If it break above the triangle then this chart become invalidated.
If you like this idea then do support it with like and follow.
Also, share your views in the comment section.
Thank You!
ALTBEARUSD trade ideas

ALTCOIN INDEX: +22% tradeHello everybody,
It seems that the alcoins have found the bottom momentarily, if this is true, it means that the alts with greater market cap will see a nice rally in the short term.
target: 2100
stop: closing below 1700

Reversal for the altcoins on the 16th of mayhey what's up traders I hope you're doing well despite the BlackRock/Citadel sponsored attack on LUNA.
Considering the fib levels of the fib circle based on previous critical resistance we just exited the bearish 2.618 and should start a more bullish phase.
There is even a bullish ABC wave showing a possible reversal for the altcoin market if it finds its new support around these prices. If we follow the fib circles on the 29th of August I would guess the top will be in and on the 8th of November the lunar eclipse will influence the altcoin market so that a bearish reversal is likely to happen.
On top of that astrology and the moon will be on our side during its lunar eclipse on the 16th which means we should expect a market reversal +-1 day from the 16th.
BUT the mad instability worldwide is so uncertain that it is primordial to only put money you can afford to lose. If things continue as it is we should see an economic collapse before the start of June.
These are only my own insight based on data I've got and the status of actual geopolitics so always DYOR to get other data points so you can make the best possible decision.
So that's it for today mates I pray for you all and until next time ! :D

ALTPERP UPDATE! ALTCOINS WILL PUMP MORE IF?Hello everyone, if you like the idea, do not forget to support with a like and follow.
Welcome to this ALTPERP INDEX update.
ALTPERP is looking good here. It is forming a symmetrical triangle in the 4hr time frame where breakout is still pending. If we get a proper breakout with good volume then we have seen a good pump in Altcoins in upcoming days.
I have already shared some Altcoins (Link given below) and try to share some more setups today. Looks like we have seen a mini Alt season in upcoming days.
Invalidation level:- If 4hr candle close below $2174 level.
If you like this idea then do support it with like and follow.
Also, share your views in the comment section.
Thank You!

Are we heading more down on this?!In my opinion altcoins are likely to bleed even more and we could see even lower prices in mid term…I think based on macro economical situations and strength of bears in market and decreased trust in Altcoins due to Luna crash we are possibly going to see even lower lows and that means increase of BTC.D which has a more bullish chart in the other hand.
Lets see how its gonna work…
Always a student.

Is it a crypto winter or a great buying opportunity ❓💎Since April Alt Index has dropped by 58%, and during the past week by 45%. But should the knife-catching buying opportunity be considered?
💎The crypto crash has resulted in massive liquidations especially if we look at Luna, losing 99%. For most this is a huge warning sign, but we know that bulls are coming when there is mostly fear.
💎Current Fear & Greed Index stands at "Extreme Fear", which is exactly when bulls prefer to take action. Looking at Alt Index, we had a clean bounce off the support, while the price is at the bottom of the descending channel.
💎The money flows from alts to the Bitcoin, yet again ....

ALT Coin's Macro PerspectiveHere is the ALT Coin landscape, from my perspective, as we navigate through 2022. Three things I would like to focus on are the ALT Coin Chart, as well as BTC Dominance and ETH/BTC Chart for support. Some very important things to consider from both past and future perspectives.
First, Let's take a look at the Alt Coin chart, and ill give a brief explanation as to why these are the two main scenarios from my perspective going forward. Most of the detailed explanation expands much further than just cryptocurrency and for that, I will link my two previous analyses on BTC and the Stock Market at the end of the post so the information is readily available. For this particular chart, we can see the price has tested support 6 times at this point. Since the 2020 run-up, Alts have created massive gaps in such a short amount of time and as we expand into tougher, more unpredictable times, these gaps will very likely be filled along the way.
For scenario #1 to occur, the course stays exactly where it appears to be headed at this moment. Ongoing war, FOMC meeting March 15-16 (Rate Hikes), Loss in momentum for all of Crypto and BTC, Market Cycles changing, Global Recession, and uncertainty staying intact.
For scenario #2 to occur, the narrative completely flips and all risk is mitigated. There is a cease-fire announced in Ukraine, FOMC meeting ends with no Rate Hikes, momentum picks back up because of these factors, Cycle stays intact, Global Recession is postponed until further notice, and there is less uncertainty. Meaning a time for Risk-ON assets.
Second, let's take a look at the BTC DOM chart and try to understand why it's important and can shed some light in uncertain times. Because the only thing we can be certain about today is absolute uncertainty.
Here is the BTC DOM chart which I have labeled what each touch of that infamous 40% Dominance support has done for both Alt's and BTC. The reason it is so important to see this correlation is because when BTC Solo Rallies, nearly every Alt lags behind. And even worse when BTC starts to see even the tiniest correction, Alts react even stronger downward. If you have been paying attention over the last year, you may have noticed this occurrence. As of right now most Alt's have not followed BTC on their ALT/BTC ratios. This is a classic example of a BTC Solo Pump.
Third, I would like to just touch on ETH as it is the closest Crypto that resembles anything other than just an "ALT" Coin. Even with how much ETH has grown and solidified itself in the market, it still clearly lags behind BTC, especially in BTC Solo Rallies I just talked about in the BTC DOM chart. ETH has consolidated 300 days inside this triangle and with BTC Solo Rallying, the risk to reward for ETH is not equal to BTC. If BTC Corrects, ETH will correct harder if it has been lagging behind. My point is, even the 2nd most popular Crypto can't stand on its own let alone the thousands of Alts that have gone up 1000%+ over the last two years. Many Alts never even recovered to the May highs since then and likely will be the same case for the foreseeable future.
If this has been interesting to you, I highly encourage checking out my two previous analyses on BTC and NASDAQ if you haven't already, as they will give further insight on more details across the 2022 Macro environment as we navigate the rest of the year.
As always, my analysis isn't meant to sway anyone one way or the other. This post is meant to encourage critical thought and to expand perspectives. With all of that being said, I truly appreciate the support over the last few months and will continue to push out update information. Thank you for making it this far and any comments are more than welcome down below;

ALTPERP - Altseason is at its topI think we are about to enter into a bear season for alts. The pattern is rhyming and we are at a point when the trap begins. The pattern will rhyme and reverse course trapping every bull longing with 100X leverage. However, I think we have not topped mid term. 2022 will be where we find the values and make the real money post apocalypse end of 2022 or 2023.
Tread carefully.


IS THIS THE RIGHT TIME TO LONG ALTS? ALTCOIN INDEX UPDATE!!Hello everyone, if you like the idea, do not forget to support with a like and follow.
Welcome to this ALTPERP INDEX update.
ALTPERP INDEX is at an important level of support. We have seen a bounce from this area multiple times. So If we go for some long positions here then the risk is very low and reward is high.
Also, Altperp is trading inside a falling wedge-like structure. If we break this wedge then we can expect a good pump in Altcoins. The same falling wedge-like structure formed previously and after the breakout, we have seen a 25% move to the upside. So I'm expecting the same this time also.
Do not long anything at CMP (Current market price). I'm still expecting the last drop in BTC and Alts. We might have some wicks below the support zone so that would be the perfect area to pick some long position.
Invalidation Level:- Any daily candle closes below 2950
If you like this idea then do support it with like and follow.
Also, share your views in the comment section.
Thank You!


ALTPERP INDEX UPDATE! A RELIEF BOUNCE INCOMING FOR ALTS!!Hello everyone, if you like the idea, do not forget to support with a like and follow.
Welcome to this ALTPERP INDEX update. ALTPERP INDEX is basically used for perpetual coins (Futures trade).
ALTPERP is forming a falling wedge like structure in 4hr time frame. Also, holding an important support level (green box) so far. Currently, it is bouncing from the lower trendline and showing some strength. Expecting a good bounce in altcoins soon.
I'll also sharing some good profitable altcoins setup soon. But remember do not trade without a stop loss and do not use high leverage.
If you like this idea then do support it with like and follow.
Also, share your views in the comment section.
Thank You!

ALTPERP D1: 40% correction WARNING/ a/b/c/d (NEW)Why get subbed to me on Tradingview?
-TOP author on TradingView
-2000+ ideas published
-15+ years experience in markets
-Professional chart break downs
-Supply/Demand Zones
-TD9 counts / combo review
-Key S/R levels
-No junk on my charts
-Frequent updates
-Covering FX/crypto/US stocks
-before/after analysis
-24/7 uptime so constant updates
🎁Please hit the like button and
🎁Leave a comment to support our team!
ALTPERP D1: 40% correction WARNING/ a/b/c/d (NEW)
IMPORTANT NOTE: speculative setup. do your own
due dill. use STOP LOSS. don't overleverage.
NOT a setup to SHORT ALTPERP Just showing
signs of weakness and recommend to stay out
of this market into the correction.
🔸 Summary and potential trade setup
::: ALTPERP D1 chart review
::: updated/revised outlook
::: correction MODE in progress
::: sequence of lower highs - BEARS
::: BEARS FLAG progress / WEAK SETUP
::: weakness will last for 4-8 weeks
::: LOG SCALE chart
::: not a great looking chart
::: limited upside from here due to
::: general market weakness and BTC weakness
::: S/R was re-tested and we are still flushing
::: price/ RSI div very clear on D1/H8 TF
::: expecting correction/pullback mode
::: CORRECTION required to attract
::: new buyers from the lows
::: 40-50% correction possible next
::: 4-8 weeks in May/June 2022
::: right now no upside in this market
::: position traders should wait for
::: better entry prices later after
::: correction MODE up next
::: be careful don't get caught up in this
::: also overextended right now
::: BULLS remain on sidelines and
::: be ready to BUY LOW later
::: recommended strategy: STAY OUT / CORRECTION WARNING
::: BULLS stay out until correction is over
::: correction run not over yet
::: good luck traders!
🔸 Supply/Demand Zones
::: N/A
::: N/A
🔸 Other noteworthy technicals/fundies
::: TD9 /Combo update: N/A
::: Sentiment mid-term: BEARS/CORRECTION
::: Sentiment short-term: BEARS/CORRECTION
RISK DISCLAIMER:
Trading Crypto, Futures , Forex, CFDs and Stocks involves a risk of loss.
Please consider carefully if such trading is appropriate for you.
Past performance is not indicative of future results.
Always limit your leverage and use tight stop loss.


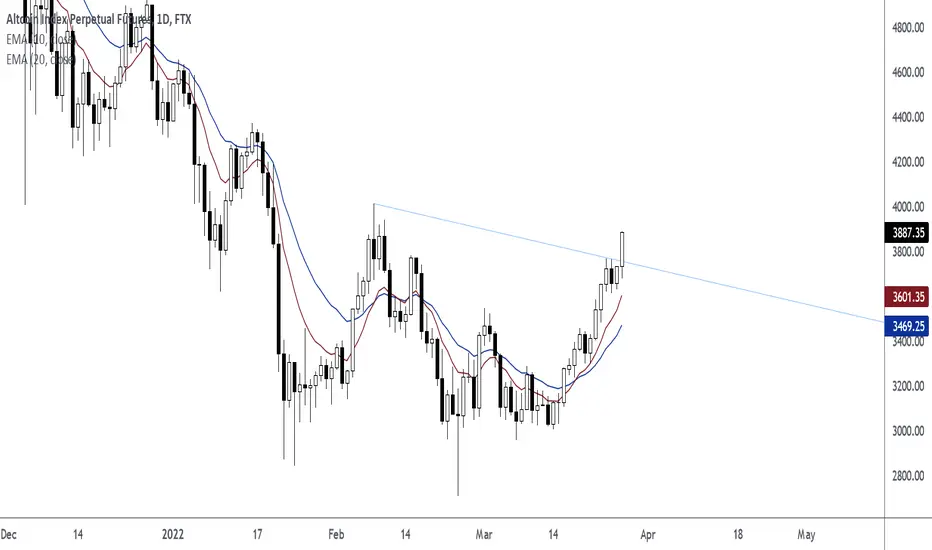
Altcoin Index - This is where the trend starts❗️💎The critical factor in the recent price action of the Alt Index is the bounce off the average-price downtrend trendline. Besides, after a bounce, we can see a double bottom formation near 3275.
💎The above-mentioned facts strongly favor the beginning of a strong uptrend. But on the other hand, we can see that the consolidation phase between 2870 - 4000 is taking place.
💎The 3275 was a decision-making point, which was ........

Ichi says "Let's play a game!"Looking at the total market one may find that it can also be measured with the same tools and dynamics of understanding like any chart.
From what i see, this since this is excludng the BTC and ETH, means money is pouring in and out, so id expect a reaction once it hits the conversion line, but the reaction of it is still unpredictable, since in stock-to-flow chart we way far from a comeback, so a stinging pierce is possible sending BTC to the Lower lows,.
Having said that, a retest or a higher high is also possible since BTC hasn't yet broken the above line of resistance and is above the 200 EMA on the daily time frame , and is now in a similar position like before, however attending that it is also below the kumo in the 3d timeframe, i think a side movement is also possible after it heits the conversion to scare people off, whilst whales start buying.
Pay attention to volume, volume is king.
Short term: Bullish
Long term: Neutral

ALTCOIN Index Perpetual Futures Forecast: 16.06% IncreaseExpect Altcoin Index Perpetual Futures to increase 16.06%
BE CAREFUL MOONBOYS🦊¶REDFOX CAPITAL™¶🦊,
Good day everyone its your man Redfox
the last time i warned about a dump when i analyzed the USDT.D index which played out perfectly now the market have recovered and everyone is happy longing but theres something on #alts index you should know , the red box is obviously a dangerous zone, and needs to be broken first before the next hurdle, there are two main area we should break first with the red box being one......
i expect a pull back from the POI then a bounce back up before finally meeting the major major area. so because what you long right now.
#REDFOXXX
like,follow & share

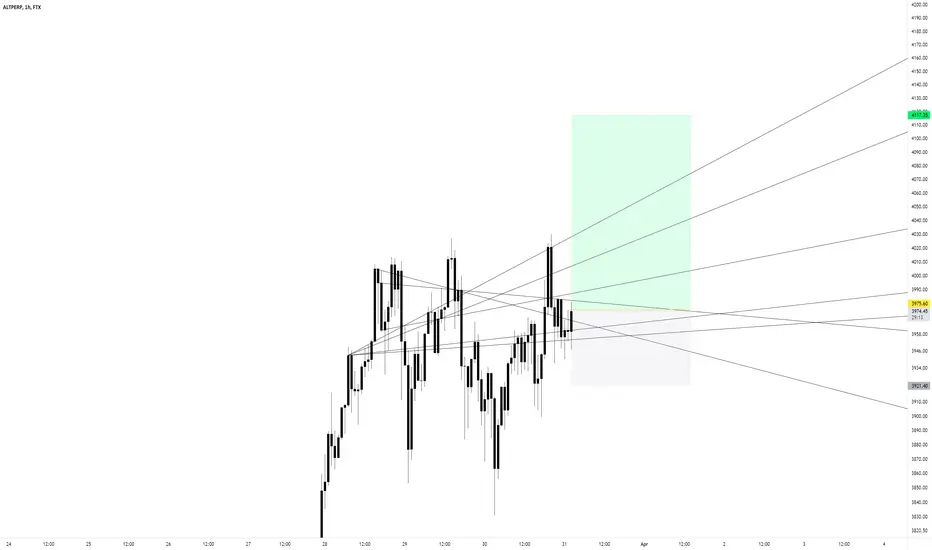
Bearish sign for the Altcoins.The chart explains it all! Not at all good for the alts.
Descending triangle has almost squeezed and thus resulting a quick volatility!
In order to ignore this bearish sign ALTPERP has to close a couple candle above the green zone! atleast a 2 candles above the 4000 to 4100 zone.
Or we may break the 3k strong support so hard and reach the next support level range of 2200 to 2500.
Safe trading!


Plan for ALTSThere’s strong bearish bias because we are still under the 200 day moving average and there’s already been a retest and rejection. However, we are sitting on a strong key level at the moment. If we break below it’s probably game over for Alts for now, but if we break the trendline both on RSI and on the chart, I’ll be confident for a reversal.

NOT A GOOD NEWS FOR ALTCOIN
For the next few days, from some source that I've gathered these 35 hours. All altcoin could react into the next support due to crypto donated for Ukraine is gonna used to buy weapons and some militarization equipment. I can't say it's a good thing to open a long position for this short-term (7-12 days). and besides that, beware with FOMC in the next week. MARCH SEEMS TO BE BLOOD FOR ALTCOIN. KEEP WATCHIN. And for Fibonacci, altcoin seems would claim the 0.786 - 1 Area, which means the price could go down.
