Testing resistance?After big fall ALTs seems to preparing for some move up. If they stand above dashed green line it is likely to test resistance at 529. Still, if we want to catch some bigger alt moves then we need to see some daily candle closed above resistance (it would be great to close it in orange box). As long as resistance isn't broken it is very possible to go more down.
ALTPERP trade ideas


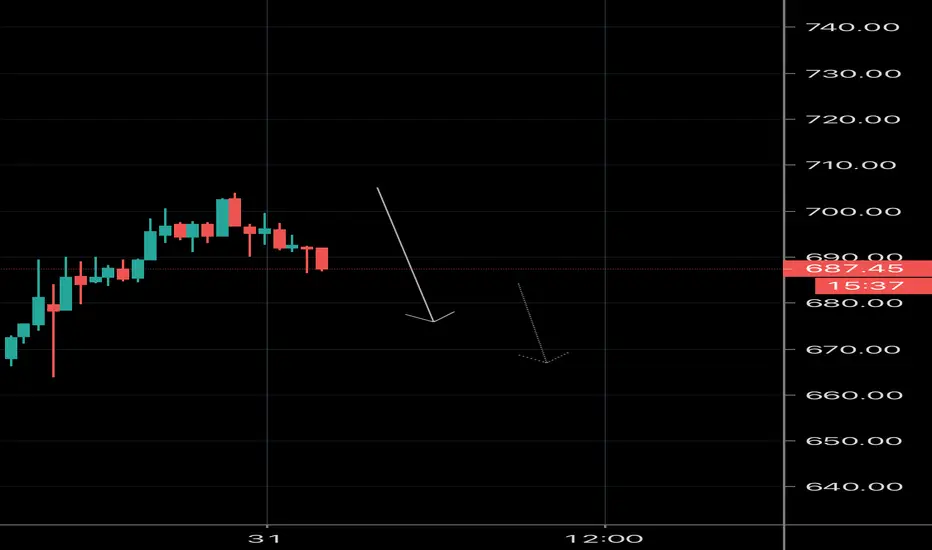
Altperp doesn't look too hot right nowIs the altcoin market in troubles ?
Altperp is a mix of all the major altcoins:
ETH, EOS, XRP, BCH, BSV, BNB and LTC
Therefore it's a very good gauge of the market and gives you an average overview of what's going.
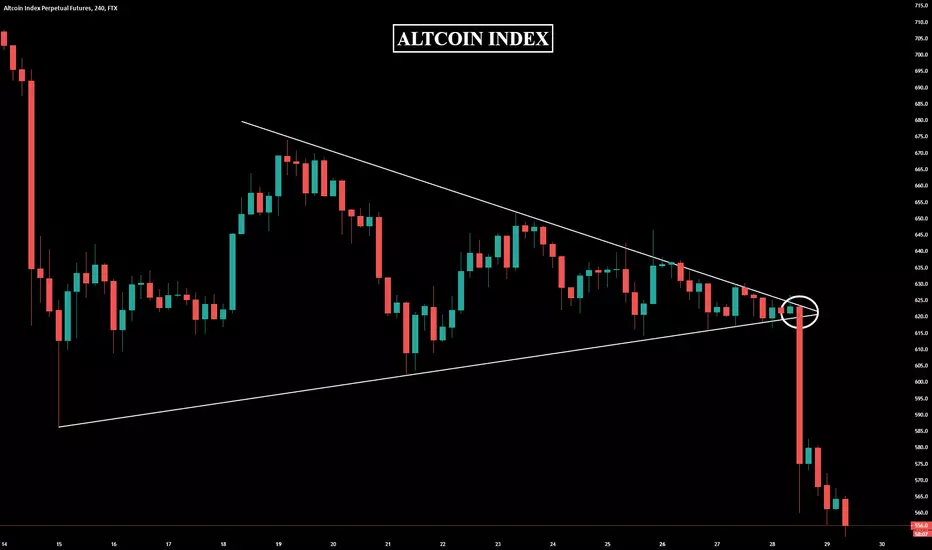
Waiting for a break either of the black line to the downside or the redline to the upside.
I think we go down but let's wait and let the market decide.


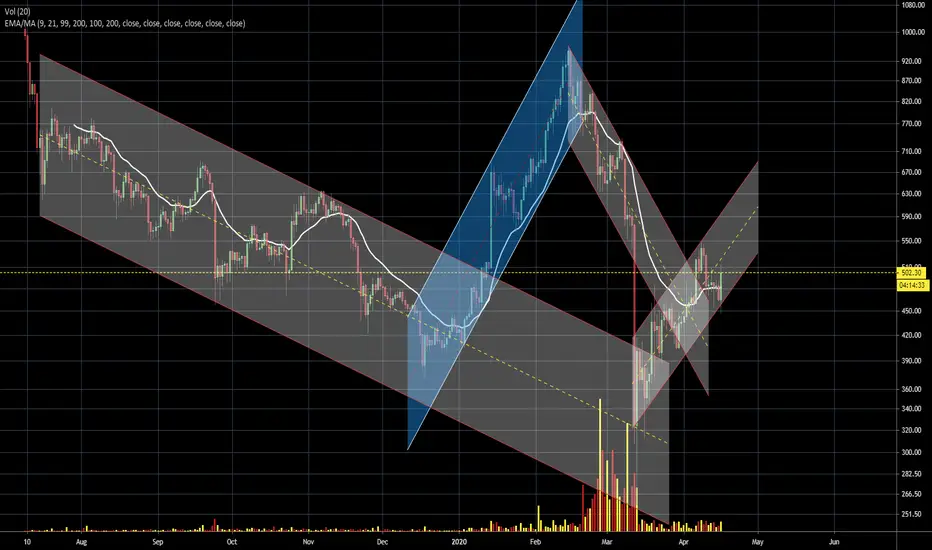
One of the very many possibilities on alt perpRight now the number of possible counts is very high though, just posting this to think about it if/when we reach this level.
Playing the breakout of the ascending triangle was a quite profitable play it seems


BTC : SHALL WE TRUST THE THURSDAY CANDLE? Hello everybody, points I will cover:
- we are in a high indecision area at 7700-7400
- data is mixed so I tried to find evidence somewhere else than BTC chart
as you know I liked the thursday candle as we got the TP there, anyway I didn't like the close much. After the spike at 7750, which would have been a great level to close at because above the retracement area and at levels pre-March dump. Also, if you follow me, you know that the accumulation area is 5800-7600 (linked idea). So, pity we didn't close above that level. Moreover, pretty much the whole movement happened in 1 hour and was not backed on friday, even if we saw some consolidation.
Other data is mixed, as Longs and Shorts position are rising together and the ratio between the 2 is approaching 1, which means that for each short open, there is a long. This means high uncertainty on the market.
We are literally trapped between upper boundary of a descending and ascending channel, so we have to find some evidence somewhere else.
I noticed that top 10 index for crypto ex bitcoin and excluding tether (for obious reasons) did not reach new local high as happened in BTC. Lower cap coins did but we know they tend to magnify BTC moves. This more mature coins "miss" makes me think that the spike was just a short squezze that triggered many longs located just . As I said, everything happened in 1 hour. The movement was not backed the day after (but there was also the futures expiry on friday). My view is bullish but I am more biased towards a down movement now. Will be interesting to see what happens on Monday.
I will provide another idea to show you exactly what I have in mind as levels and as channels. This was just to provide you with other data. Let me know what you think!

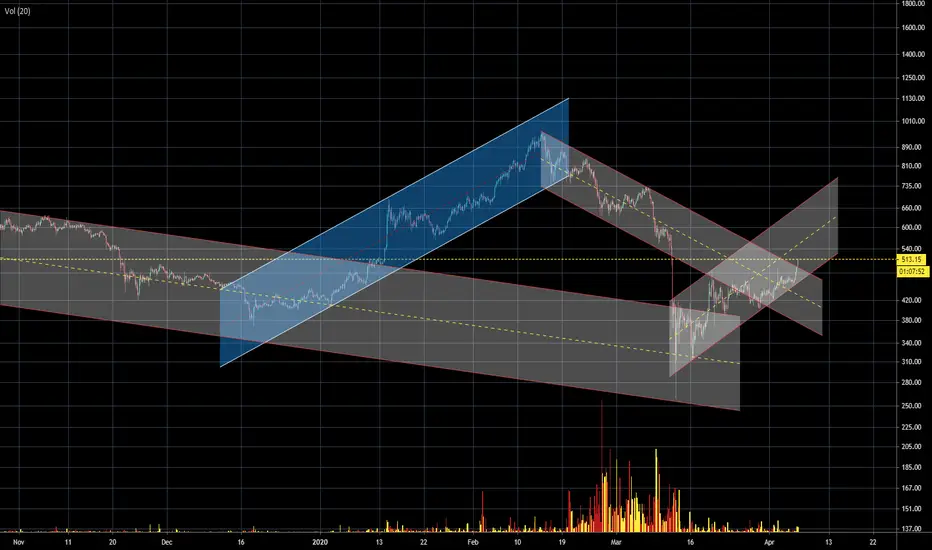
ALTCOIN PERPETOURS CONTRACTSALTCAP ARE TRADING IN CHANNELS. By the way, this means alt coins have a good future! Not all of it but for sure the big caps. Because, why make an chart for this? Think about that. I think in the future we will see one of the biggest alt coin runs we ever see! We will be wealthy and have a good future! By the way, volume is coming in, good sign. There is more trading :)
Just my opion! :)
Have a good night / day mates! Cheers ;)
Mind all these hidden bullish divergenceJust something to note, hidden bullish divergence on lots of pairs

Stay away from altsHello everyone, this is our view on altperp, enjoy!
Analysis:
Their were nothing and they're supposed to be nothing. But we can make good profit as well. We're now approaching sellzone in a big bull flag which we're not breaking out these days for sure due to no volume in most of alts. We had a good time, but now a big dump is coming for Bitcoin too. We've just ended a no reason (classical reason to see one) parabolic move, now preparing for the following falling wedge. Ended the Elliott impulse waves, so now expecting a retracement through C. Golden cross ma50-ma200, but i believe that's due to very large movement we made according with bitcoin. First target short will be on ema200. Already below wma10, now minor resistance. Waiting for the next pump through the upper band, which will certainly mark an higher high in overbought and then dump it straight to lower band. Ichimoku cloud is thin as there was no resistance during the pump. Bearish divergence on fisher transform and on many laggings (chaikin, moneyflow, rsi, stoch and uo, all of them from overbought), which of course have good room for a leg down in an uptrend, but it could be very large as well. In particular stochastic looks very bearish on many different lenghts (14,3,3 ; 20,3,3 ; 14,3,50 ; 14,3,100). Bearish momentum on ao, which also marked a bearish divergence. On the other hand macd looks very good in momentum, but formed a bear pattern and a death cross too. Big G accumulation on greed & fear.
Strategy:
Just like btc, expect one more higher high (lower high on bigger timeframes) and then the dump. Alts will bleed, go short on them while growing another 2-3% before the dump. Always put stoploss in your trades.
Trade safe. Anlvis.

Altseason Guaranteed PMA NPXS XDN GAME TRX ADA LTC XRP And more
altseason Guaranteed
Come on guys
The whales are already ready
Now it's altseason
Tips For Buy
PMA
NPXS
DTA
GAME
Storm
XDN
FLDC
TRX
ADA
BCH
RDD
PTON
And all lower coins


ALTS at important resistanceI feel worry for alts, as alts index is close to both horizontal resistance and descending channel border. Breakout will certainly be followed by pumping alts, while rejection will put alts into red zone for 2-3 days at least.
Month closing so bearish, that dead cat bounce is actually possible. Week no that bearish - which again lead us to dead cat bounce =) And that bounce will be after the New Year.

Brace yourself for the inevitable Altseason blastBrace yourself for the inevitable Altseason blast
Now it's altseason
Tips For Buy
PMA
NPXS
DTA
GAME
Storm
XDN
FLDC
TRX
ADA
BCH
RDD
PTON
And all lower coins

Brace yourself for the inevitable Altseason blastBrace yourself for the inevitable Altseason blast
Now it's altseason
Tips For Buy
PMA
NPXS
DTA
GAME
Storm
XDN
FLDC
TRX
ADA
BCH
RDD
PTON
And all lower coins


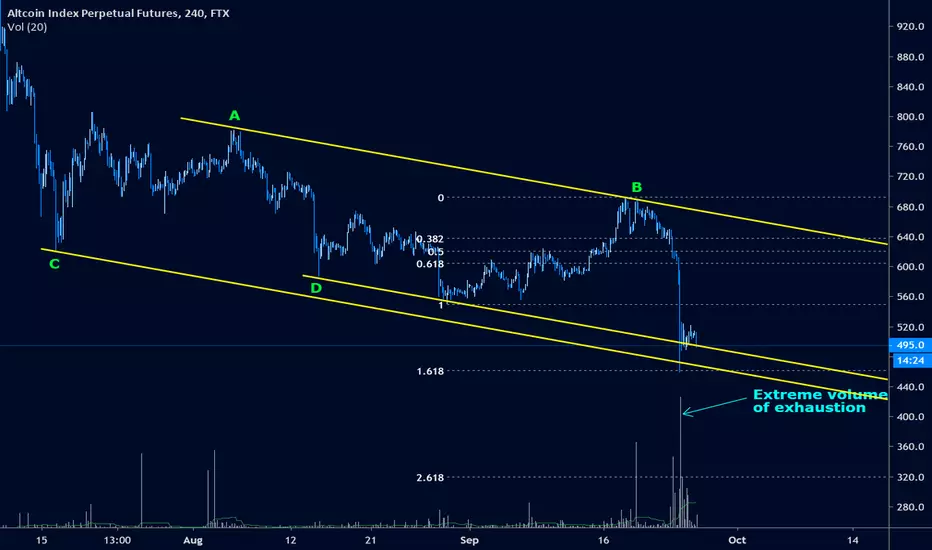
The signs are there - the bears are finished for nowConsider the angular symmetry in this chart. The yellow line that connects points A and B is used to determine the angle of descent from historic data. When that line is copied with the exact same angle and projected from the previous low labelled C, the result is more support around the 1.618 level. Projecting the same line from the interim low marked D gives more support for the close prices a little higher.
Altcoin has just finished a classic 1.618 extension (see white Fibonacci levels). This is a strong support indications. The price came down to support on a large candle on extreme volume. This is called a selling climax and is, in this case, a sign of trend exhaustion. Bears would probably struggle to push price any lower.
These signs indicate the bears have had their say and the bulls will likely take over. A break below 458 would invalidate the other signals and suggest bears are back in control. Otherwise, there's plenty of upside.
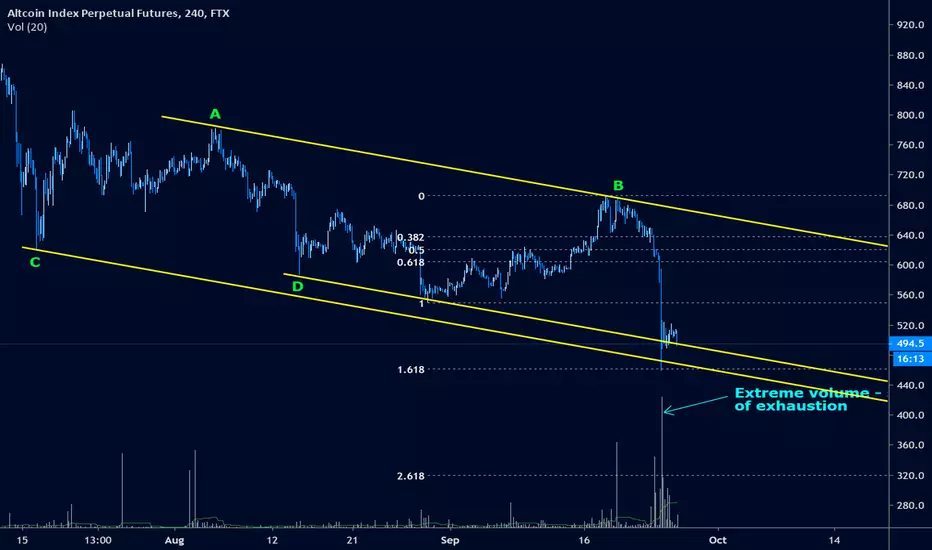
Altcoins - The choice is always yours.Hi, today we are going to talk about Altcoins and its current landscape.
We had a strong impact on the price after he was squeezed by the Downtrend and Uptrend Lines. However, the Bears won this journey, making an expressive Breakout of the Uptrend Line with massive volume, creating then a toxic environment for the Altcoins, pushing away the dream of the Altseason. Unfortunately, this is just the start of the Bears Feast. Reduce your exposure in Altcoins, because of a tsunami is coming.
Thank you for reading and leave your comments if you like.