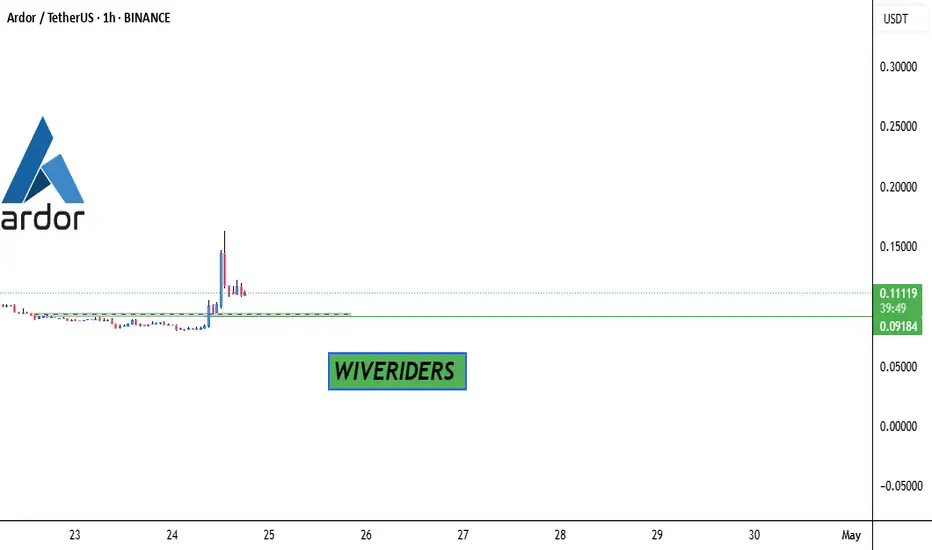
Waiting for Green Light!🚀 SEED_DONKEYDAN_MARKET_CAP:ARDR - Waiting for Green Light! 🚦
📈 Price pumped, now observing for a pullback to the green zone (potential support). 👀 Looking for a solid entry for the next leg up! ⬆️
ARDRUSDT trade ideas
ARDRUSDT // According to your risk perception, our first target point is 8 exponential moving average. Our second target point is Kaufman indicator. Stop loss would be the right decision in closings below 0.04301 level.

ARDRUSDT: Blue Box Looks Promising!ARDRUSDT: Blue Box Looks Promising! 🚀
Here’s the quick breakdown:
Volume Surge: A 100% daily volume spike—buyers are waking up!
Key Zone: The blue box is shaping up to be a strong potential demand zone.
Next Steps: Waiting for confirmation—bullish market structure breaks on lower time frames or a strong reaction with CDV support.
This setup looks like a great opportunity if conditions align. Patience is key here—don’t chase the move, let the trade come to you.
Boost, comment, and follow for more insights like this! Let’s make it happen! 💪
Let me tell you, this is something special. These insights, these setups—they’re not just good; they’re game-changers. I've spent years refining my approach, and the results speak for themselves. People are always asking, "How do you spot these opportunities?" It’s simple: experience, clarity, and a focus on high-probability moves.
Want to know how I use heatmaps, cumulative volume delta, and volume footprint techniques to find demand zones with precision? I’m happy to share—just send me a message. No cost, no catch. I believe in helping people make smarter decisions.
Here are some of my recent analyses. Each one highlights key opportunities:
🚀 RENDERUSDT: Strategic Support Zones at the Blue Boxes +%45 Reaction
🎯 PUNDIXUSDT: Huge Opportunity | 250% Volume Spike - %60 Reaction Sniper Entry
🌐 CryptoMarkets TOTAL2: Support Zone
🚀 GMTUSDT: %35 FAST REJECTION FROM THE RED BOX
🎯 ZENUSDT.P: Patience & Profitability | %230 Reaction from the Sniper Entry
🐶 DOGEUSDT.P: Next Move
🎨 RENDERUSDT.P: Opportunity of the Month
💎 ETHUSDT.P: Where to Retrace
🟢 BNBUSDT.P: Potential Surge
📊 BTC Dominance: Reaction Zone
🌊 WAVESUSDT.P: Demand Zone Potential
🟣 UNIUSDT.P: Long-Term Trade
🔵 XRPUSDT.P: Entry Zones
🔗 LINKUSDT.P: Follow The River
📈 BTCUSDT.P: Two Key Demand Zones
🟩 POLUSDT: Bullish Momentum
🌟 PENDLEUSDT.P: Where Opportunity Meets Precision
🔥 BTCUSDT.P: Liquidation of Highly Leveraged Longs
🌊 SOLUSDT.P: SOL's Dip - Your Opportunity
🐸 1000PEPEUSDT.P: Prime Bounce Zone Unlocked
🚀 ETHUSDT.P: Set to Explode - Don't Miss This Game Changer
🤖 IQUSDT: Smart Plan
⚡️ PONDUSDT: A Trade Not Taken Is Better Than a Losing One
💼 STMXUSDT: 2 Buying Areas
🐢 TURBOUSDT: Buy Zones and Buyer Presence
🌍 ICPUSDT.P: Massive Upside Potential | Check the Trade Update For Seeing Results
🟠 IDEXUSDT: Spot Buy Area | %26 Profit if You Trade with MSB
📌 USUALUSDT: Buyers Are Active + %70 Profit in Total
🌟 FORTHUSDT: Sniper Entry +%26 Reaction
🐳 QKCUSDT: Sniper Entry +%57 Reaction
📊 BTC.D: Retest of Key Area Highly Likely
This list? It’s just a small piece of what I’ve been working on. There’s so much more. Go check my profile, see the results for yourself. My goal is simple: provide value and help you win. If you’ve got questions, I’ve got answers. Let’s get to work!

ARDRUSDTWe can attempt to buy ARDRUSDT from specified level as it makes HL , also 0.786 FIB level intact indicate that it moves upward.
SL , TP mention in chart.

Ardor: The Wait Is Over! Strong Bullish Jump Next!I keep sharing this one over and over and over... But everything is fine. Each time I shared it its price is a little bit higher.
ARDRUSDT (Ardor) has been growing slowly but steadily. It continues to grow but only slowly.
Notice the MA200 black line. The action is happening safely above this level. Long-term bullish bias confirmed. Above MA200 we can expect a sudden jump any day now.
ARDRUSDT (Ardor) has been growing slowly but slowly it will grow no more. The consolidation phase is over... Notice the cup pattern, the action is happening above the baseline and also the golden ratio fib.
ARDRUSDT is about to grow fast, fast and high... Any day now, we can see a strong sudden bullish jump.
Ardor has been growing for months... The wait is over.
Namaste.

Ardor Bullish Since July, Can Grow Strong (278% -365% Potential)When a pair goes bullish, it tends to produce a very long period of consolidation, sideways, boring, small jumps that are quickly corrected, etc. Only after 2-3 months of this, does the real strong bullish action starts.
Ardor (ARDRUSDT) is at this point, ready for strong growth. It bottomed in July 2024. It produced a bullish wave that was corrected to a higher low, followed by consolidation and another bullish jump and we are currently within higher low territory. There is potential here for a major jump.
There is super high volume recently and other pairs are breaking bullish. Caution though, as market conditions can always change.
This pair looks good but we've been tracking it and trading it on its BTC pair, ARDRBTC. Here it is already moving and we like to get the bottom low. On the BTC pair we got the bottom so we have lower risk. The choice is yours.
Namaste.

#ARDR (SPOT) entry range(0.06350- 0.0685) T.(,10390) SL(,06256)BINANCE:ARDRUSDT
entry range ( 0.06350- 0.06850)
Target1 (0.07590)- Target2 (0.09149) - Target3 (0.10390)
SL .1D close below (0.06256)
**** #Manta ,#OMNI, #DYM, #AI, #IO, #XAI , #ACE #NFP #RAD #WLD #ORDI #BLUR #SUI #Voxel #AEVO #VITE #APE #RDNT #FLUX #NMR #VANRY #TRB #HBAR #DGB #XEC #ERN #ALT #IO #ACA #HIVE #ASTR #ARDR ****

ARDRUSDTWe can attempt to buy ARDRUSDT from specified level if it break LH ,also making double bottom (reversal pattern) , also bullish divergence occur indicate that it moves upward.
SL , TP mention in chart.

Trading SIGNAL ARDR/USDTTrading Setup:
A Trading Signal is seen in the #ARDRUSDT (4HOUR) (LONG TERM)
Traders can open their Buy Trades NOW
⬆️Buy now or Buy on 0.0790$ - 0.0780$
🔵TP1 : 0.0900$
🔵TP2 : 0.1$
🔵TP3 : 0.105$
🛑SL : 0.0750$ After Entry 3
BINANCE:ARDRUSDT

#ARDR Ardor broke out and retested an upper border of a falling#ARDR
Ardor broke out and retested an upper border of a falling wedge on the weekly chart👀
Breakout of this pattern suggests a trend reversal with a strong bullish impulse📝
A rise with a 400% upside potential is expected✈️

#ARDR/USDT #ARDR
The price succeeded in breaking the bear flag.
At the price of 0.9000. The price trended upward.
after penetrating the Moving Average 100.
The first goal is 0.2000.
The second target is 0.2666
This rise is supported by seven sells on the MACD
But attention must be paid to the correction before completing the ascent.

ardr looking good for 2 3x recovery seems like ardr has already bottomed out and finally preparing for solid gains in midterm
formed text book descending channel and testing its crucial resistance trendline with multi years long horizontal accumulation zone once both got cleared massive recovery can start
incase of successful breakout expecting 200 to 300% bullish wave

#ARDR/USDT#ARDR
The price has chosen the bearish channel to the top and the channel is now being retested again at the 0.0900 level.
We have a higher stability moving average of 100
We have an uptrend on RSI
We also have a bullish incentive from the rise of Bitcoin
Entry price is 0.0900
The first target is 0.1000
The second goal is 0.1086
The third goal is 0.1181

✴️ Ardor 164% + 247% Move In The MakingThe good thing about this timing —as in this is moment right now— is that the consolidation phase is long-gone. Even a "bullish consolidation" where prices are rising slowly still takes month. This is gone.
➖ Ardor (ARDRUSDT) has been rising for more than five months and is trading weekly above EMA100. Ultra-bullish bias confirmed.
While in the past it would take months, we can see the following targets hit within a few days, a few weeks or maximum a month or two if things get ugly; so it should be fast.
See additional details on the chart.
Namaste.

✴️ Ardor Goes Bullish (Also ✳️ ARDRBTC)In the past we would have to go through so many calculations... It was not easy to determine when each pair would move.
We track Bitcoin pairings (ALTSBTC) and Tether pairings (ALTSUSDT).
In the past, each side would have its own schedule, its own cycle... This isn't the case today. Today, it all moves together when it comes to the individual project, this is what I've been seeing.
When an Altcoin goes bullish, it goes bullish on its Tether and Bitcoin pairings, which is great.
✔️ So now we have a bullish bias on ARDRBTC and ARDRUSDT, at the same time.
You can check the ARDRBTC trade idea for additional information.
Namaste.

ARDR buy setupGiven the bullish iCH and iBOS, we have a bullish view on ARDR.
We have a liquidity pool above, which is expected to move from the demand range towards this pool.
Closing a 4-hour candle below the invalidation level will invalidate this analysis.
Note that the financial market is risky, so:
Do not enter any position without confirmation and trigger.
Do not enter a position without setting a stop.
Do not enter a position without capital management.
When we reach the first TP, save some profit and try to move the stop continuously in the direction of your profit.
If you have any comments please post them, comments will help us improve our performance
Thanks

ARDR ANALYSIS🔮 #ARDR Analysis 💰💰
🌟🚀 As we can see that there is a formation of Falling Wedge Pattern in #ARDR in 1W time frame. Broken out could lead to a relief rally towards $0.1500 📈📈
🔖Current Price --- $0.0963
🎯Target Price ----- $0.1500
⁉️ What to do?
- We have marked some crucial levels in the chart. We can trade according to the chart and make some profits in #ARDR. 🚀💸
🏷Remember, the crypto market is dynamic in nature and changes rapidly, so always use stop loss and take proper knowledge before investments.
#ARDR #Cryptocurrency #DYOR

ARDRUSDT -- ARDOR touching MA200 and FIB 0.786Ardor is close to MA200 and FIB "golden entry" point. Let us try this pattern. First target is close to 0.1060 but the "last" one close to 0.1500, so more than 50% potential

ARDRUSDTARDRUSDT is in bearish trend.
Potentially printing LH and LL.
No sign of trend reversal.
Trend is in strong berish then we sell at CMP.

ARDRUSDT 400% Potential!ARDRUSDT technical Analysis Update.
ARDRUSDT has been ranging for the last 550 days. We can expect a good up move soon.
Buy zone : Below $0.131
Stop loss : $0.102
Spot trade.

ARDR/USDT
nice accumulation box remind me of NASDAQ:LINK before it broke out of it, how to trade this sir?
two ways
1) you can enter now and put a SL below the white dashed line!
2) put an alert just below the orange resistance line and trade the breakout!
after accumulation = pump

ARDR/USDT - Ardor: Trend Reversal◳◱ On the $ARDR/ CRYPTOCAP:USDT chart, the Trend Reversal pattern suggests momentum building up for a significant move. Traders might observe resistance around 0.0966 | 0.1027 | 0.1165 and support near 0.0828 | 0.0751 | 0.0613. Entering trades at 0.092 could be strategic, aiming for the next resistance level.
◰◲ General info :
▣ Name: Ardor
▣ Rank: 303
▣ Exchanges: Binance, Hitbtc
▣ Category/Sector: Infrastructure - Smart Contract Platforms
▣ Overview: Ardor offers a live multi-chain “blockchain as a service” platform based on a revolutionary parent/child chain architecture. This architecture, in combination with 250+ APIs and lightweight smart contracts coded in Java, allows businesses to launch custom blockchains (“child chains”). Each child chain on the Ardor platform can interface with off-chain databases while leveraging the Ardor parent chain’s decentralized network of nodes for energy-efficient proof of stake security.
◰◲ Technical Metrics :
▣ Mrkt Price: 0.092 ₮
▣ 24HVol: 731,043.724 ₮
▣ 24H Chng: 4.903%
▣ 7-Days Chng: 3.49%
▣ 1-Month Chng: 36.47%
▣ 3-Months Chng: 14.53%
◲◰ Pivot Points - Levels :
◥ Resistance: 0.0966 | 0.1027 | 0.1165
◢ Support: 0.0828 | 0.0751 | 0.0613
◱◳ Indicators recommendation :
▣ Oscillators: NEUTRAL
▣ Moving Averages: STRONG_BUY
◰◲ Technical Indicators Summary : BUY
◲◰ Sharpe Ratios :
▣ Last 30D: 2.40
▣ Last 90D: 1.70
▣ Last 1-Y: 0.38
▣ Last 3-Y: 0.44
◲◰ Volatility :
▣ Last 30D: 1.50
▣ Last 90D: 0.98
▣ Last 1-Y: 0.86
▣ Last 3-Y: 1.19
◳◰ Market Sentiment Index :
▣ News sentiment score is N/A
▣ Twitter sentiment score is 0.52 - Bullish
▣ Reddit sentiment score is 0.55 - Bullish
▣ In-depth ARDRUSDT technical analysis on Tradingview TA page
▣ What do you think of this analysis? Share your insights and let's discuss in the comments below. Your like, follow and support would be greatly appreciated!
◲ Disclaimer
Please note that the information and publications provided are for informational purposes only and should not be construed as financial, investment, trading, or any other type of advice or recommendation. We encourage you to conduct your own research and consult with a qualified professional before making any financial decisions. The use of the information provided is solely at your own risk.
▣ Welcome to the home of charting big: TradingView
Benefit from a ton of financial analysis features, instruments and data. Have a look around, and if you do choose to go with an upgraded plan, you'll get up to $30.
Discover it here - affiliate link -

