BIG trade ideas
On your mark, Get Set...BIG finally has some bullish confirmation signals according to the following:
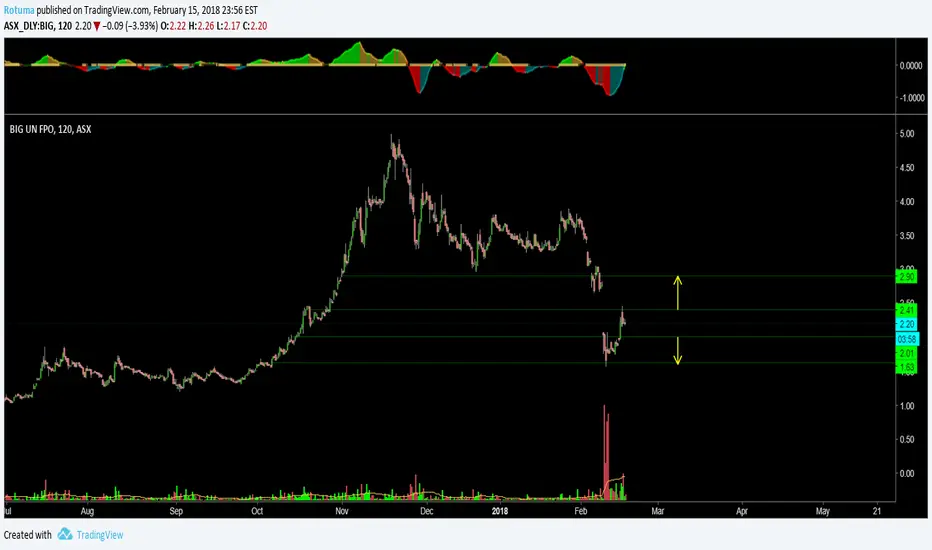
LONG evidences:
Bullish engulfing bar on Fib Ret 50%
DI crossover UP
MACD crossover (most likely UP)
HOLD evidences:
Candlestick got stuck in green cloud.
Price closed today hit the top boundary of the green cloud.
Price closed today hit 40 SMA.
We see the price is getting near to a resistance level at R1.
Trade safe with your own risk management

Reversal Fake or Beginning, time tells how BIG is heading!Gap open above HNS and closes below HNS level (4hour).
VV
RT: 1.21, RT crossing above RT 1.0 after a down fall RT < 1
CI: 1.84
What is the price action doing in recent 2 candles?
Will the gap support provides enough bounce to continue the moment upward only time tells..

BIG time is ticking... ContinueThis analysis involves 3 charts
Top left: Daily with H&S pattern
Top right: 4H with Descending Triangle pattern
Bottom: Ichimoku analysis
Monday is a critical moment for BIG, keep an eye close on the descending triangle breakout because it may have a higher chance to fall below the support level as the future cloud (red) told us.
Tenkan-sen is flat, therefore short term resistance is $3.455
BIG time is ticking again...

BIG time is ticking...Hello Aussie traders,
After the hanging man bearish reversal (on daily graph), BIG found support near Fib Ret 50%. And it soared 21% today !
From the 4H chart on the left, it is still early to confirm it is a correct structure of head & shoulder.
From the 4H graph on the right, we know the crossover Down occurred. Will it break the kinjun-sen resistance tomorrow?
BIG time is ticking...
Left chart: LONG position entry price > $4.17 (Fib Ret 23.6%)
Right chart: LONG position entry price > $4.135 (Kinjun-sen resistance, and also confirm if Chinkou span stays above price)
Good luck.

BIG, does it need a correction?Below are some indicators data last five days
3-Nov-17 RT= 2.00 DPO= 1.68 RSI= 90.3 Stoch (K)= 93.0
2-Nov-17 RT= 2.00 DPO= 1.49 RSI= 88.4 Stoch (K)= 94.1
1-Nov-17 RT= 2.00 DPO= 1.54 RSI= 88.4 Stoch (K)= 95.8
31-Oct-17 RT= 1.99 DPO= 1.25 RSI= 85.1 Stoch (K)= 95.3
30-Oct-17 RT= 1.92 DPO= 1.03 RSI= 81.0 Stoch (K)= 92.2
All the values of RT, DPO, RSI, Stoch (K) has reached overbought atm.
I couldn't imagine BIG gain another 7% after the doji on 2-Nov. But it is very close to the top line of Fibonacci Fan in weekly chart.
For those of you still hold this stock, target is $3.71

108% return in 1 month by triangle breakoutLeft chart:
Point 3: RT crossover happened two days earlier than MACD crossover
Breakout occurs after LH point 4', and had a pullback to $1.55.
The following day showed a confirmation of LONG.
Right chart:
Many sellers took profit near $2.67 as the price range from triangle breakout reached, so the candlestick formed a inverted hammer.
This hammer wasn't strong because the buying volume has been increased day by day.
Use Fib. Ext to project target profit which is near $3.25 (also intersection of resistance trend line)


$BIG potentially under accumulation$BIG is worth watching for a bounce after the recent minor pivot breakout and then low volume pullback. Potential long on an above average volume bounce.
Down days have been on relatively low volume vs up days. The high volume break below support in early September turned out to be a Spring (it looks like a classic Wyckoff Bag Holding where the pros soaked up all the supply after they push $BIG below support to trigger stops).

Patience, not emotionWe need to wait a few more hours in 2H chart to confirm if the pin bar were a bullish one.
In Daily chart, there are not any hints for a reversal.

Trading trains your patient.As markups
This stock needs a correction for a healthier run. Check the Fibonacci ratios.

How a penny stock SHINE !I think BIG.AX is the best stock in Australia atm. It has been soared about 102% in just ONE month.
I have never been so aggressively to trade a stock many times in one month, and I don’t usually use 4H charts for stocks trading, but BIG.AX is exceptional.
BIG.AX has a Relative Timing of 1.99 yesterday, which is excellent on a scale of 0.00 to 2.00. When RT is >1.80, it is considered as overbought. Please notice.
By using Fibonacci Fan and Extension, we will know when to sell to protect your profit before correction.

BIG.AX time to have a restThis stock has climbed aggressively after the master crossovers.
It is now for a correction to Fib Ret. 38.2%.

62% return in 20 days on a penny stock BIG.ASXThis is a very good trend-base demonstration for beginners.
The Left graph simply told you how to spot the swing point for the best place to enter your position.
I believe all of you have excellent Mathematics skills, but I am not sure whether you are familiar with the bars / candlesticks addition. Therefore, I circled the bars for you there.
Again, this stock was filtered by a US founded stock analysis program. This program saved me a lot of time to study the fundamentals.
The Right graph simply told you how to use Fibonacci Fan to find your exit position, you may also find there is another small channel (pink) running since 15-Jun.

Why Fibonacci is your friend in trading stock or ForexThis is a 60 min time frame, indicators required:
Stochastic oscillator with parameter 8,3,3
8 EMA & 20 EMA
When to buy if you missed the boat of EMA crossover on 16-Jun
Mind Read:
1) Any Fibonacci Retracement Level? Answer: 23.6%, 38.2% (=S1)
2) Wait for reversal signal (black up arrow), did it close above 8 EMA? Answer: Yes
3) Stochastic (8,3,3) shows price convergence
4) LONG during phase 1
When to sell ? (Reverse Thinking)
Retracement level from 5-Jun 15:00 to 20-Jun 13:00 was 23.6%, then I project another Fibonacci Retracement (grey colour) to let its 38.2% overlap to old one. Therefore I will expect the highest price will reach somewhere near $0.938.
By confirming this is the highest price, I draw two parallel orange trend lines. $0.938 is trapped.
Risk:
Stop-loss to be considered near S1 ($0.78), about 6%

BIG hit a resistance level This time we combined 3 different timeframes in the same screen. They are 60mins, 240 mins and daily.
We keep 8 EMA & 20 EMA on each charts
The charts on different timeframe showed an uptrend, we can simply create a channel with the same base to that up-trend line (orange), and move the top line of that channel to the previous highest price around 0.86. The current price has hit the top line of the channel as a resistance at 0.97.
Because of today’s open price is gapped up. We may take a lot concerns. At the end of today, we don’t want to see a shooting star formed. If you bought this stock at the blue arrow marker by 10000 shares. You may consider to sell 5000 shares to secure your profit. For the next 5000 (if the shooting star has yet formed), we target sell at 1.272 level of Fibonacci Extension.

How BIG soars over 20% in 3 days With the help of VectorVest, this stock was filtered in the Unisearch Bottom Fishing strategy in 5-Jun-2017
Parameters edited into:
EPS < 0
RT > 1.0
CI > 1.65
Sector <> Energy, ETFs, Telecom Svcs, Utilities
Results of Top 5 stock descending by VST*RT are
BBX.AX, BIG.AX, GSC.AX, DNK.AX, TAW.AX
After seeing the graphs, only BBX.AX and BIG.AX to be considered.
When to buy ?
Mind Read:
Price actions stand on 40 SMA & Fibonacci Retracement Level 38.2%
Any risks? Yes, stop loss to be under this level.
When to sell ?
Check triangles breakout Small triangle (purple) & Large triangle (blue)
Check shooting star at point 2 (purple), locate the next resistance will be somewhere close to 0.89 (its wick may reach 0.9 as well according to Fibonacci Channel)
