Death Cross looming CBA.Death Cross 200 MA & 50 MA looming for CBA. Let's hope we get a bounce. If not see next support levels below
CBACD trade ideas

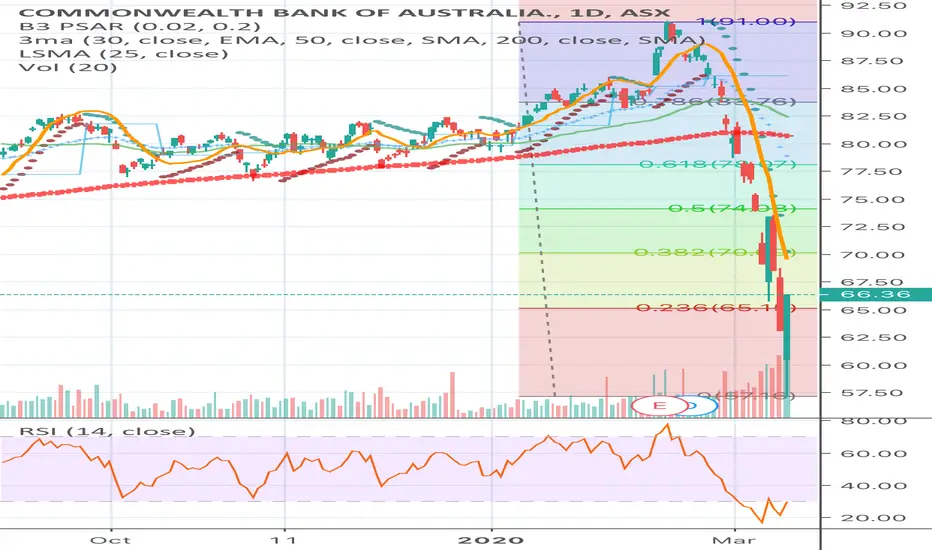
CBA bounce explainedCan we without any doubt attribute CBA to the RSI bullish divergence? Is it too early to say that the bounce is for sure? In any case we dont rub a crystal ball here to know what the future holds. However, one indicator showed an early sign of the recent bounce. That indicator is none else the RSI dvergence. Of course 57, recent bounce level, is in the historic R/S levels but in terms of divergence, You can see price lower lows with an RSI higher low. This theory needs to be validated in coming days. Soon I will share the targets for TP.
BANK ROBBER on the loose! - CBA AWAIT RETEST AREA over coming months, but give them hell if price signals short opportunity..

Automated Trading guide- My latest inovationDid you ever wanted to have a pro trading guide at your disposal to tell you what to do?
Perhaps you just need a hint so you don't make emotional decision.
My latest Quantum Thermoballs is packed with new features, and just now it equipped with my trading experience to guide you so you can let your profit run, cut your losses, buy cheap and sell on top daya trading only
It is still a proof of concept but it is very promising.
Let me know your thoughts


CBA to retrace back to moving average. $CBACommonwealth Bank of Australia had a good rally the last few trading days and shares likely to retrace back to the moving averages. Technical indicators such as the MACD, RSI, DMI and TD Sequentials are showing bulls are running out of energy.


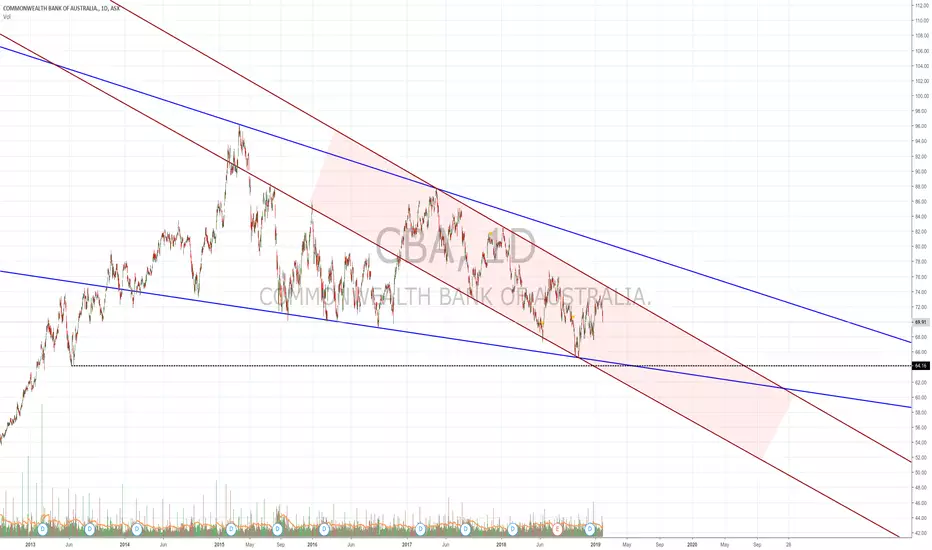
CBA break downCBA broke to the down side of the rising wedge.
now price trading in a down trend channel.
chart looks bearish like WBC.
RBA cuts will not help. Its game over
for the asx200 which is basically the big 4 banks.
Commonwealth Bank of AUS to retrace back to moving averages $CBASell or Short $CBA.
Commonwealth Bank of Australia to retrace back to moving averages.
More likely to retrace back to the 200 moving average (red line) at this stage to form an ABC correction.
Or retrace back to trendline support.


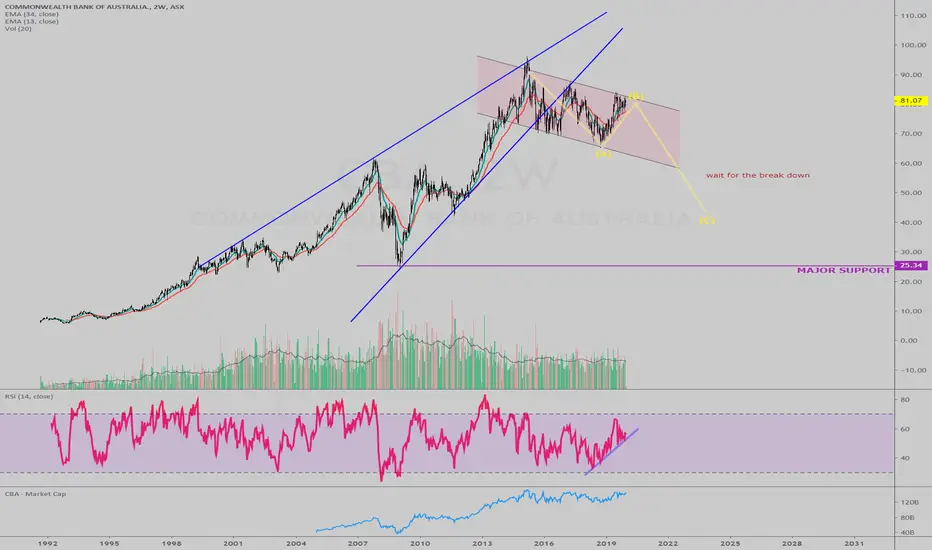
CBA.ASX finally giving inFrom everything I’ve read over the years commonwealth bank has been a widow maker for many traders looking to short. I almost bought some $65 put options earlier this year which would have expired in October. Lucky me! Any way, looks like this may finally be it. To me it looks like a big tripple top has been out in here. With the real estate market in Australia easing up a little and commbank being so heavily exposed to the housing market any dip will ravage them. Keeping in mind we have a prime minister who has taken a page out of draghis book looking to do what ever it takes to keep the Aussie housing bubble blowing.
Circled in green are our three tops. It’s also important to note the 200 weekly MA has just punched through the 20MA. There are also two lower lows as valley between our tops. A break below $70 will be the final bell.

Buy and Sell zones for Cba currently bouncing between levelsHi everybody. This is a chart showing you possible sell zones and buy zones due to resistance that we have encountered before and support which is the .618 fib level.


CBA a short opportunityThe price action is moving in a pennant since 29 Aug 18 which is getting squeezed.
Now the price line hits the 200MA resistance, pivot 1st resistance and the pennant's resistance.
If we take the complete pennant in fixed range of volume profile then it can be easily seen that sofar the trader's interest in this area is less.
Moreover the price action has formed a complete bearish shark pattern and completed the last leg and entered in potential reversal zone.
The indications are more in favor of bearish move at the moment so it can be sold here and can be bought again between pivot point and 100 SMA support which is around 72.54 to 71.42.
The targets are:
Sell between: 74.40 to 75.55
Can be bought again between pivot and 100SMA support
Regards,
Atif Akbar (moon333)


$CBA $70.78 short Thx for the heads up Mr Hugh HNLcapitalChart has notes on what weakness looks like

$CBA the end is nigh?Really not liking this weekly chart. Gap down outside of the support line and well below the 30 week WMA. Still 4 days in the week but if it stays outside of the trend line I think it's only down from here and possibly last time above $70.