ATOMUSDT.P trade ideas

ATOM/USDT longwaiting for CHoCH on 5-15m tf and open long , follow the risk management and don't forget to put stop loss

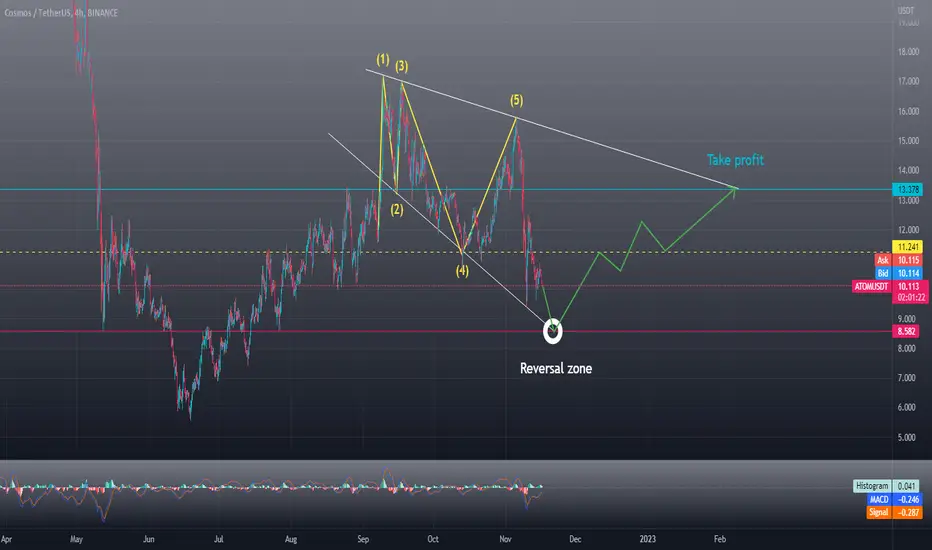
COSMOSThe news background in the cryptocurrency market creates pressure on the price. Top cryptocurrencies show price decline. The panic that began in the market due to the situation with the FTX exchange provoked great distrust in the crypto industry sector. Cryptocurrency ATOM also shows a decline, which I think has not ended yet. But there is hope for the New Year's rally, which can partially save the situation.
Atomic bombBased on the broken trendline, I do not expect ATOM to create a new high. A new low may mean. bullish divergence. Prepare to short at resistance.


Cosmos (ATOM) - November 15Hello?
Traders, welcome.
If you "Follow", you can always get new information quickly.
Please also click "Boost".
Have a good day.
-------------------------------------
(ATOMBTC 1W chart)
If it is supported in the 0.005 440 ~ 0.0006 266 section, it can be seen that the power of the rise is large.
--------------------------------------
(ATOMUSDT 1W Chart)
It declined in the important zone of 12.887-15.083.
The volume profile section and the HA-Low indicator are passing through the 8.060-9.603 section, so if supported in this section, it is likely to turn into an uptrend.
(1D chart)
The important thing is whether you can rise to the 12.887-15.083 section and be supported.
If not, you need to make sure it is supported in the 8.060-9.603 section.
Therefore, it is necessary to check whether there is a movement out of the 9.603-12.887 range due to the volatility around November 21st.
-------------------------------------------------- -------------------------------------------
** All descriptions are for reference only and do not guarantee profit or loss in investment.
** If this chart is shared, you can use the indicators normally.
** The MRHAB-T indicator includes indicators that indicate points of support and resistance.
** HA SRRC indicators are displayed as StochRSI (line), RSI (columns), and CCI (bgcolor).
** The CCI indicator is displayed in the overbought section (CCI > +100) and oversold section (CCI < -100).
(Short-term Stop Loss can be said to be a point where profit or loss can be preserved or additional entry can be made by split trading. This is a short-term investment perspective.)
---------------------------------


ATOMUSDT 1HATOM at this exact moment visiting the median of the keltner channel, being able to migrate straight to the upper edge at 11,196, it all depends on how the market in general is absorbing the blow suffered. The high-octane ATOM will get through this crisis just fine. Here are their supports and resistances:
S: 10,374 / 9,368 / 8,575
A: 11,196 / 11,826


✅TS ❕ ATOMUSD: rebounded strongly✅✅ ATOM rebounded strongly from the support level.
The price is going up and will soon reach the resistance level.
I expect a rebound from the resistance.✅
🚀 SELL scenario : short to 10.243.🚀
----------------------------------------------------------------------------
Remember, there is no place for luck in trading - only strategy!
Thanks for the likes and comments.

long ATOM$ATOM bounced off the major support level on the daily chart. Following the good macroeconomic data published today, bullish movement to resistance level at 17$ is likely to happen.

Atom (cosmos) One of my best ALT Coins .
I predict before it will go to 5 $
Now 5 is easy target , although it pull-up to 17$Where it was best performing crypto in bear market .
I know ppl bought it at 10 thinking its going to the moon from their ! I think 5 $ is a good price to buy .
Shorting to 8 $ from here (not financial advice )
GOOD LUCK

Atom downtrend movementatom is in a downtrend channel and as you can see it bounce from the demand zone and also fibo 0.50, but I think its downward movement will continue and the next target for the short position is placed around 9.96 and 8.96
if we see good support around them can long here, but I think we will touch 5.55 again, for taking a long position it's better to wait and watch the reaction to our channel's lower band. if break 8.96 and close at least 1 daily candle below it. I am sure we will touch 5.55 again.
I am already in a short position and my target is on the chart...
I consider all analyses performed in relation to that trade position.
Our analysis is not a buy or sell referral.
If you found our analysis useful and interesting, feel free to share it so that more individuals might benefit from it.
And please don't forget to like and comment; we will read them all.

ATOM SHORT SETUPHello, dear traders. how are you ? Today we have a setup to SELL/SHORT the ATOM symbol.
For risk management, please don't forget stop loss and capital management
When we reach the first target, save some profit and then change the stop to entry
Comment if you have any questions
Thank You


