AUDUSD.P trade ideas


Short trade
Day TF overview
Sellside trade
Mon 31st March 25
5.00 pm (NY Time)
NY Session AM
Structure Day
Entry 4Hr
Entry 0.62668
Profit level 0.61308 (2.17%)
Stop level 0.63038 (0.59%)
RR 3.68
Reason: WMA (100) and EMA (50)
Observed for sellside directional bias
along with the price failing to make a
higher high.
Target 0.382 (PD Array)
4Hr TF overview


AUD_USD WILL FALL|SHORT|
✅AUD_USD is trading in an
Downtrend and the pair
Made a bearish breakout
Then made a retest and
Is going down now again
So we are bearish biased
And a bearish continuation
Is to be expected
SHORT🔥
✅Like and subscribe to never miss a new idea!✅
Disclosure: I am part of Trade Nation's Influencer program and receive a monthly fee for using their TradingView charts in my analysis.

AUDUSD Triangle Break Looms on Tariff RiskAUDUSD is trading inside a triangle pattern that's been forming for 83 days. A break below 0.6215 could trigger a 188-pip drop, with a 3.82 risk-reward setup. While the RBA held rates at 4.1%, upcoming US tariffs on Liberation Day may pressure the Aussie. Fundamentals and technicals align for a potential bearish move.
This content is not directed to residents of the EU or UK. Any opinions, news, research, analyses, prices or other information contained on this website is provided as general market commentary and does not constitute investment advice. ThinkMarkets will not accept liability for any loss or damage including, without limitation, to any loss of profit which may arise directly or indirectly from use of or reliance on such information

AUDUSD 4h Descending ChannelAUD/USD Analysis - April 1, 2025 (1H Timeframe)
Trend Overview
The pair is currently in a descending channel, forming lower highs and lower lows—indicating a downtrend.
Price has reached a strong demand zone (purple box) around 0.6240 - 0.6260, which has previously acted as support.
Key Levels to Watch
Support Zone (0.6240 - 0.6260)
If price holds and forms bullish price action (e.g., higher low, engulfing candle), we could see a reversal to the upside toward 0.6280 - 0.6300.
Bullish Confirmation: Break above 0.6260 and a close above the descending trendline.
Resistance Levels:
0.6260 (Immediate resistance & trendline rejection zone)
0.6280 - 0.6300 (Major resistance if the breakout happens)
Bearish Breakdown Scenario
If price fails to break 0.6260 and gets rejected at the trendline, it could lead to a drop toward 0.6220 - 0.6200.
Bearish Confirmation: A strong rejection from 0.6260 or a break below 0.6240.
Trade Scenarios
✅ Bullish Case (Reversal / Breakout)
Entry: Above 0.6260 with confirmation (trendline breakout)
Target 1: 0.6280
Target 2: 0.6300
Stop Loss: Below 0.6235
🔻 Bearish Case (Continuation of Downtrend)
Entry: On rejection at 0.6260 or breakdown below 0.6240
Target 1: 0.6220
Target 2: 0.6200
Stop Loss: Above 0.6270
Conclusion
Watch for price action at 0.6260. A breakout = bullish move, rejection = bearish continuation.
Bias: Neutral for now, waiting for confirmation.

No Rate Hike, No Mercy – AUD/USD Selling in Style!Riding the wave of bearish structure, AUD/USD continues to follow the macro trend with laser precision. After the RBA held rates steady, we’re seeing the typical post-news dump play out—fueled by the market’s disappointment and reduced sentiment.
Technically, price respected the 4H Fair Value Gap (FVG) and showed strong displacement to the downside, confirming continuation.
Key Targets:
🔻 0.62311 – Minor liquidity
🔻 0.62185 – 1H Sell-side liquidity
🔻 0.61703 – Ultimate short-term sell-side target
Expecting the market to bleed lower unless major fundamentals flip the bias. Until then... the trend is your bestie.
DYOR 🧠📉

AUDUSD SELL 0.6280On the daily chart, AUDUSD fluctuated downward, and the bears had the upper hand. At present, you can pay attention to the resistance near 0.6280. If the rebound encounters resistance, you can consider continuing to sell. The support below is around 0.6190. If it falls below, it will go to around 0.6100. If the price breaks through the resistance near 0.6330, it will start to rise.

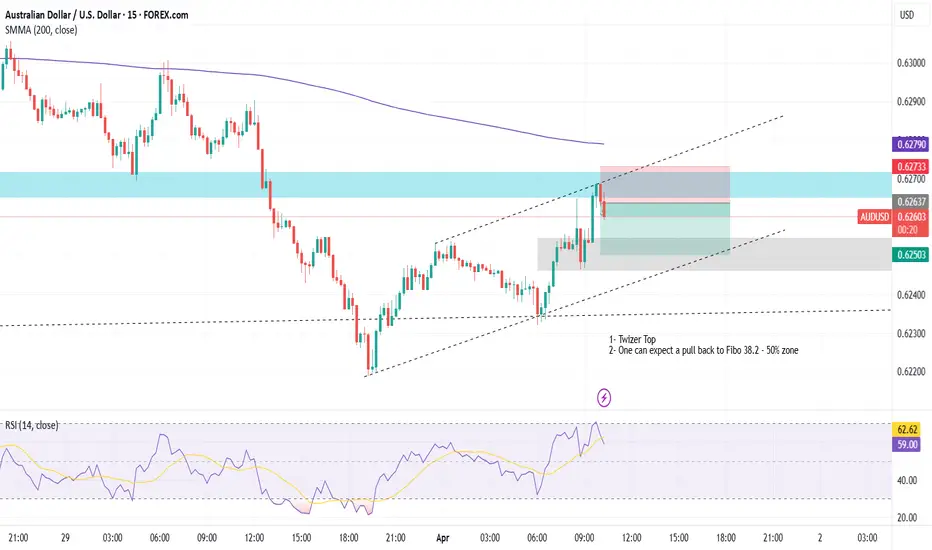
01-04-2025 _ Short Term Bearish Idea _ AUDUSD M151- Twizer Top
2- One can expect a pull back to Fibo 38.2 - 50% zone
AUDUSD: Strong Bearish PatternIt is likely that the 📉AUDUSD will drop lower in the near future.
The formation of a head and shoulders pattern, along with a breakout of its neckline after testing a key resistance, indicates a strong bearish signal.
The target is set at 0.6218.

RBA Holds Their Cash Rate, May Cut Neither Confirmed Nor DeniedThe RBA held their cash rate at 4.1%, and keep a May cut up in the air without any appetite to commit to one. I highlight my observations on the RBA's statement, before updating my analysis for AUD/USD, AUD/CAD and GBP/AUD.
Matt Simpson, Market Analyst at City Index and Forex.com

AUDUSD-SHORTAU is forming a beautiful bearish trend on a 4 hr time frame. AU is also a correlative pair with GA and we see that GA just broke a consolidation zone to the upside giving potential signs of bullish continuation. If AU respects FIB zones, it should continue to the downside to form next lower low. Of course, news will play a role in our bias for now and we will wait for entry before taking sells on AU.

Shorting AUDaily chart showing bearishness.
4h chart showing potential internal range to external range move. Fair value gap is in premium
1h showing SMT divergence and entry above opening price

AUDUSD & NZDUSD Sell idea/analysis based on daily timeframeTook this trade based on a downtrend forming and the retest of a H&S on the daily chart with a minimum requirement of 1 lower low and 1 lower high. I saw a bounce before the price touches the previous low on the 4-hour chart, which could shape my 2nd lower high, and I entered the trade.

AUDUSD Bearish Breakout!
HI,Traders !
AUD-USD made a bearish
Breakout of key horizontal
Level of 0.62670 so we are
Bearish biased and after
A potential pullback we will
Be expecting a further
Bearish move down !
Comment and subscribe to help us grow !


Why the RBA should cut rates todayThe Reserve Bank of Australia should cut rates today, argues James Glynn in the Wall Street Journal .
Markets, however, expect the central bank to wait until May for its next move. RBA Governor Michele Bullock remains cautious, citing lingering inflation.
But Glynn contends that global uncertainty now outweighs the RBA’s desire to wait for marginal improvements in inflation data. That uncertainty is set to escalate this Wednesday, with the Trump administration announcing sweeping tariffs on U.S. trading partners—likely triggering retaliatory measures.
Andrew Boak, chief economist at Goldman Sachs Australia, appears to support Glynn’s view: “There are costs to waiting until May to cut. Waiting is not always a virtue.”
Is Glynn simply chasing a contrarian headline or is there actually a possibility the RBA could act today?

AUD/USD BUY zone H4 chart analysisAUD/USD:
Trade Setup
Entry: 0.62517
Final Target (TP): 0.64963
Stop Loss (SL): 0.61800 (Below recent support to protect against invalidation)
Support & Resistance Levels
Support Levels: 0.62200 - 0.62500 (Potential demand zone)
Resistance Levels: 0.64000 - 0.64963 (Major supply zone & upper trendline resistance)
Trade Outlook
Bullish Bias: Price is expected to rise from the support zone.
Confirmation Signals: Look for bullish rejection wicks, engulfing candles, or a break above 0.63100 for momentum confirmation.
Risk-to-Reward: Favorable setup with a good upside potential.

Heading into pullback resistance?AUD/USD is rising towards the resistance level which is a pullback resistance that aligns with the 50% Fibonacci retracement and could reverse from this level to our take profit.
Entry: 0.6276
Why we like it:
There is a pullback resistance level that aligns with the 50% Fibonacci retracement.
Stop loss: 0.6321
Why we like it:
There is an overlap resistance that line sup with the 61.8% Fibonacci retracement.
Take profit: 0.6214
Why we like it:
There is a pullback support level.
Enjoying your TradingView experience? Review us!
Please be advised that the information presented on TradingView is provided to Vantage (‘Vantage Global Limited’, ‘we’) by a third-party provider (‘Everest Fortune Group’). Please be reminded that you are solely responsible for the trading decisions on your account. There is a very high degree of risk involved in trading. Any information and/or content is intended entirely for research, educational and informational purposes only and does not constitute investment or consultation advice or investment strategy. The information is not tailored to the investment needs of any specific person and therefore does not involve a consideration of any of the investment objectives, financial situation or needs of any viewer that may receive it. Kindly also note that past performance is not a reliable indicator of future results. Actual results may differ materially from those anticipated in forward-looking or past performance statements. We assume no liability as to the accuracy or completeness of any of the information and/or content provided herein and the Company cannot be held responsible for any omission, mistake nor for any loss or damage including without limitation to any loss of profit which may arise from reliance on any information supplied by Everest Fortune Group.

AUD/USD 1-hour downtrend - Will 0.6200 Trigger a Reversal?The AUD/USD pair has been trending downward on the 1-hour chart, maintaining strong bearish momentum. In its latest move lower, it formed a significant 1-hour Fair Value Gap (FVG), aligning closely with the 0.786 Fibonacci retracement level.
Given this confluence, there is a possibility that AUD/USD could revisit this level to reject and continuing its decline. However, if bearish pressure persists, the pair may extend its drop toward the key 4-hour support at 0.6200.
A potential bullish engulfing candle at this 0.6200 support level could signal a shift in market structure, indicating a possible change of character to the upside. However, it is still uncertain if we will revisit this 4-hour support.

AUDUSD Price ActionHello Traders,
Liquidity is what makes supply and demand zones truly powerful. As you can see, I've marked both the supply and demand areas—each supported by clear liquidity levels on both sides.
With that structure in place, we can now look for long opportunities, but always with proper risk management in mind.
Just remember: No Liquidity = No Zone Confirmation.
Keep it simple, stick to the rules.
Good luck and happy trading!

AUDUSD - LONGSWe managed to get a pin point entry by using the buy limit & now were looking for a second entry if the market comes back to retest this area as highlighted.
Our TP is @0.64 which is 180 pips. This trade could take over a week to play out lets see how the market moves this week!
