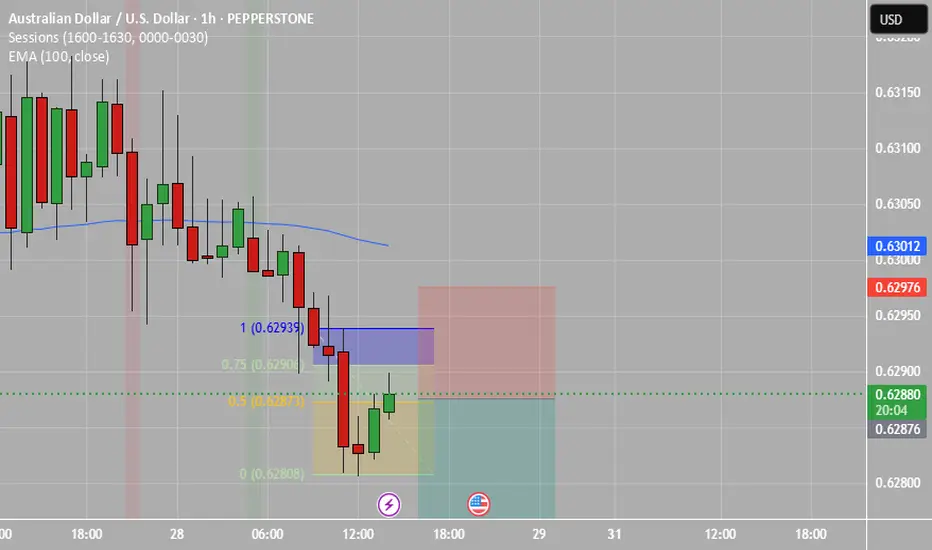
AUD/USD 1H – Testing Demand Zone for a Potential Reversal?The pair is currently retesting a strong demand zone, with multiple rejections seen in this area. A Break of Structure (BoS) indicates bullish potential, but price needs to confirm a reversal before a strong upside move.
📊 Key Observations:
✔ Break of Structure (BoS): Bullish intent was confirmed earlier.
✔ Swing Structure Support (SSS): Holding for now, but a deeper test of demand is possible.
✔ Demand Zone Reaction: If price holds above 0.6270–0.6255, a bullish reversal is likely.
🔎 Trade Idea: Looking for bullish confirmations within the demand zone. A clean rejection could offer long opportunities toward recent highs.
AUDUSD.P trade ideas

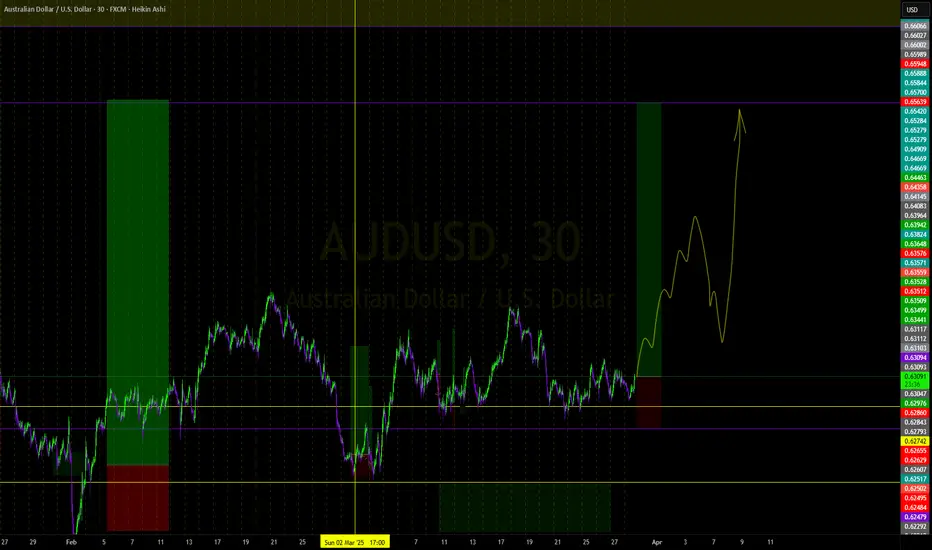
AUDUSD | APRIL 2025 FORECAST| This Next Move will be Massive!AUD/USD is shaping up for a critical month, with price action hovering around a key support zone near . The pair has been reacting to , influencing both bullish and bearish momentum.
🔹 Trend Analysis: The pair remains in a on the higher timeframe, with acting as dynamic support/resistance.
🔹 Key Levels: Support at , resistance at .
🔹 Momentum & Structure: A break above could trigger bullish continuation, while failure to hold may lead to a deeper retracement.
With fundamentals aligning with technicals, this month could present solid trading opportunities. Will AUD/USD push higher, or are we in for a reversal? Drop your thoughts below! 🚀📊 #AUDUSD

AUDUSD: Bears Will Push Lower
The price of AUDUSD will most likely collapse soon enough, due to the supply beginning to exceed demand which we can see by looking at the chart of the pair.
Disclosure: I am part of Trade Nation's Influencer program and receive a monthly fee for using their TradingView charts in my analysis.
❤️ Please, support our work with like & comment! ❤️

AUD/USDAUD/USD Technical Setup
Entry: 0.63094
SL: 0.62479
TP: 0.66288
Current price action suggests a potential upward move with strong support near 0.62479. Watching for confirmation and momentum continuation. Trade with proper risk management. #Forex #AUDUSD #TechnicalAnalysis
Master the Market with These 5 Wave Trading RulesHello,
In any business, rules are the backbone of success, providing the structure and discipline needed to thrive. Trading and investing are no exceptions—they must be treated with the same seriousness and rigor as any entrepreneurial venture.
As a wave trader, I rely on a refined set of rules that blend technical analysis with Wave Theory to understand market behavior. Wave trading is a powerful strategy that analyzes price patterns to uncover the cyclical nature of market trends, enabling traders to predict future movements and seize profitable opportunities.
Understanding Wave Trading
Markets don’t move randomly—they ebb and flow in predictable waves. According to Elliott Wave Theory (a type of wave theory), trends unfold in a series of five waves (known as impulses) followed by three waves (corrections). Mastering this rhythm allows you to anticipate where the market is headed next, giving you a strategic edge.
Our Trading Rules
Here’s a breakdown of the essential rules I follow as a wave trader, designed to guide you through the process with clarity and precision:
Identify Impulse & Correction
Impulse: A robust, directional price surge made up of five sub-waves, signaling the dominant trend.
Correction: A smaller, counter-trend move consisting of three sub-waves, acting as a pause or pullback.
Recognizing these phases reveals the market’s underlying structure. For example, spotting a five-wave impulse upward suggests a bullish trend, while a three-wave correction might signal a temporary dip—perfect for planning your next move.
Identify the Pattern Formations
Look for patterns that can help you anticipate the next moves e.g. the expanding triangle, Bullish flag or even reversal patterns.
Identify Entry Points
Timing is everything. Pinpoint the perfect moment to enter a trade based on your wave and pattern analysis.
Wait for confirmations like a breakout above a flag pattern or a signal from indicators such as moving averages or MACD that align with your wave count.
Look for Targets
Set clear profit targets to stay disciplined and secure gains.
Wave projections, like the expected end of wave 5 in an impulse.
Look for Exits in Case the Trade Doesn’t Go Your Way
Not every trade is a winner, and that’s okay. Protect your capital with stop-losses placed at logical levels.
Where to set them: Choose points that invalidate your analysis—like below a key support level or a wave pattern’s critical threshold. If the market breaks that level, your trade idea’s likely wrong, so exit calmly.
This removes emotion from the equation, safeguarding your account for the long haul.
The Power of Discipline
These rules aren’t just guidelines—they’re your shield against the emotional rollercoaster of trading. Write them down, pin them up, or keep them handy on your trading desk. Reviewing them before every trade reinforces your commitment to a systematic, objective approach. Discipline turns good strategies into great results.
Wishing you success on your trading journey!
Disclosure: I am part of Trade Nation's Influencer program and receive a monthly fee for using their TradingView charts in my analysis.


AUD/USD BULLISH BIAS RIGHT NOW| LONG
AUD/USD SIGNAL
Trade Direction: long
Entry Level: 0.629
Target Level: 0.631
Stop Loss: 0.627
RISK PROFILE
Risk level: medium
Suggested risk: 1%
Timeframe: 1h
Disclosure: I am part of Trade Nation's Influencer program and receive a monthly fee for using their TradingView charts in my analysis.
✅LIKE AND COMMENT MY IDEAS✅

AUDUSD SellAUDUSD has tested the MRZ level in H1 and H4 TF . planned and executed to sell AUDUSD.
looking at 1:5RR for this trade.
lets see how the trade goes.
RBA preview and Australian dollar analysisI discuss whether the RBA will cut next week and the reasons why, before taking a look at AUD/USD, AUD/CAD, EUR/AUD and GBP/AUD charts.
Matt Simpson, Market Analyst at City Index and Forex.com

Continue to be bullish.Economic Fundamentals
Australia: Its economic growth, inflation and export prices affect the Aussie. Growth aids appreciation; inflation undermines it. Higher resource prices boost the currency.
US: Strong US data strengthens the dollar, weakening AUD/USD; weak data has the opposite effect.
Market & Geopolitical Factors
High risk appetite benefits the Aussie; low appetite favors the dollar. Geopolitical tensions prompt a flight to the dollar, hurting the Aussie.
💎💎💎 AUDUSD 💎💎💎
🎁 Buy@0.62500 - 0.62800
🎁 TP 0.63500 - 0.64000
The market has been extremely volatile lately. If you can't figure out the market's direction, you'll only be a cash dispenser for others. If you also want to succeed,Follow the link below to get my daily strategy updates


We’re bullish on AUDUSDTechnical Analysis
AUDUSD lies below 50 - period SMA (0.6324, declining) and 100 - day SMA (0.6512, falling), indicating a downward trend yet short - term upside potential. January 2025 RSI bullish divergence shows weakening downward momentum. Break above 0.6340 could push it to 0.6400; otherwise, it may range 0.6131 - 0.6302.
Economic Fundamentals
Australia: Its economic growth, inflation and export prices affect the Aussie. Growth aids appreciation; inflation undermines it. Higher resource prices boost the currency.
US: Strong US data strengthens the dollar, weakening AUD/USD; weak data has the opposite effect.
Market & Geopolitical Factors
High risk appetite benefits the Aussie; low appetite favors the dollar. Geopolitical tensions prompt a flight to the dollar, hurting the Aussie.
💎💎💎 AUDUSD 💎💎💎
🎁 Buy@0.62500 - 0.62800
🎁 TP 0.63500 - 0.64000
The market has been extremely volatile lately. If you can't figure out the market's direction, you'll only be a cash dispenser for others. If you also want to succeed,Follow the link below to get my daily strategy updates

AUDUSD 110 buy setup!!The current market structure shows a strong alignment for a potential upward movement, forming a double bottom at a significant support level. This pattern respects both the structural levels and Fibonacci retracement levels. With important news scheduled for release today at 8 PM, particularly positive developments for the dollar could influence market direction. Given the risk-to-reward ratio, it appears favorable to consider positioning for an upward trend.
follow me for more breakdown

AUD/USD at a Crossroads: The Battle of Breakouts and SupportsTrade frictions remain a headwind in the market. US trade measures have triggered concerns, and the Australian economy, which is dependent on exports to China, may be impacted. Meanwhile, inflation triggered by tariffs conflicts with concerns about a slowdown in the US economy. The Federal Reserve has maintained the interest rate unchanged and adjusted its economic forecasts.
The Reserve Bank of Australia (RBA) cut interest rates in February, and future actions will depend on inflation data. Employment positions decreased in February while the unemployment rate remained stable. The upcoming release of the monthly CPI indicator for February is of great concern. The net short - positions of the Australian dollar have increased, and market sentiment is bearish.
Technically, if the AUD/USD breaks through key levels, there is upward potential. If the bears dominate, there are multiple support levels. Momentum indicators show mixed performance.
AUDUSD
sell@0.63500-0.63000
tp:0.62500-0.62000
I will share trading signals every day. All the signals have been accurate for a whole month in a row. If you also need them, please click on the link below the article to obtain them.

AUDUSD(20250327)Today's AnalysisToday's buying and selling boundaries:
0.6298
Support and resistance levels:
0.6350
0.6331
0.6318
0.6278
0.6265
0.6246
Trading strategy:
If the price breaks through 0.6298, consider buying, the first target price is 0.6318
If the price breaks through 0.6278, consider selling, the first target price is 0.6265

AUDUSD longsI’m bullish on AUDUSD, my name is wizardfx for a reason so no explanation just follow the plan.

AUDUSD InsightHello, subscribers!
I’m glad to see you all here. Please share your personal opinions in the comments. Don’t forget to like and subscribe!
Key Points
- Maroš Šefčovič, the European Commission’s Executive Vice President for Trade and Economic Security, stated after a meeting with U.S. officials that President Trump is expected to impose a 20% tariff on European goods next week.
- President Trump signed an executive order imposing a 25% tariff on foreign automobiles imported into the U.S.
- St. Louis Fed President James Bullard commented that Trump’s tariff policy is likely to have a lasting impact on inflation rather than being a one-time event.
- Australia’s February CPI rose by 2.4% year-on-year, indicating easing inflationary pressures. Markets are anticipating that the Reserve Bank of Australia will cut interest rates in May.
Key Economic Events This Week
+ March 28: U.K. Q4 GDP, U.S. February Personal Consumption Expenditures (PCE) Price Index
AUDUSD Chart Analysis
The price continues to test the upper resistance but has failed to break through. As a result, the likelihood of a decline is increasing, with the expected support level around 0.60000.
However, if unforeseen factors lead to a breakout above the resistance level, the price could reach as high as 0.66000, in which case a swift strategy adjustment will be necessary.

AUDUSD Buy NowBuying Setup Based on a very strong Potential Reversal zone which is Support zone for this Pair. Indicates potential Bullish momentum. Accordingly TPS and SL is highlighted with proper Risk Management. Normally market responds to such Support Zones. what are your thoughts?

AUDUSD 1H forecastLooking for a potential sell continuation on AU, either it being an impulse down or a correction down.
Currently projecting a wave 3/C, which is gonna be a 5-wave sequence as well.

AUDUSD(Better RRR)As the Price is Falling We are Buying with better risk reward Ratio..SL below todays low ENJOY!!!

Audusd Audusd I posted this trade last week on my profile we hit the first tp and this is the second entry

DeGRAM | AUDUSD growth in the channelAUDUSD is in an ascending channel between the trend lines.
The price is moving from the support level, which has already acted as a rebound point, as well as from the lower boundary of the channel and the trend line.
The chart maintains the local upward structure and has formed a harmonic pattern.
On the 1H Timeframe, the indicators indicate that the chart is working out the formed bullish convergence.
We expect the growth to continue in the channel.
-------------------
Share your opinion in the comments and support the idea with like. Thanks for your support!

AUDUSD ShortsFrom next week, we will be targeting swing sells on AUDUSD in hopes to break the rising support of this apparent bearish flag pattern. Be on the lookout for the rest of this week to see if AUDUSD rises to our sell zone.
