downtrendGiven the recent downtrend, it is expected that the downtrend will continue to form until the next support levels.
If the price consolidates above the green resistance area, the above scenario will be invalidated.
AUDUSD.P trade ideas

#audusdLevels where price reactions are most likely to occur during the day. Naturally, at each level, you can have buy and sell positions and you can freely use the levels for a new order or for TP of your postions. The levels are updated daily!
The results of price reaction to these levels will be shown in the upcoming videos.

Dont lose money shorting AUDUSD, IT IS GOING UPI want you to use this trade to learn compounding. Buy any small retracement you see as long as we dont hit sL. This buy will be for a long time and AUD will be stronger than EUR and GBP
Stop selling pls, just fund your real account and buy.
Follow me as most of my trades are market order so you see and trade it on time

WEEK OF 4/6/25: AUDUSDLast week was clearly bearish leading to all time frames being bearish.
Starting the week with a high probability POI to look for entry models from to take shorts to the next daily demand level.
Impactful news: Inflation 4/10
Thanks for stopping by and goodluck traders!

AUDUSD TRADE SETUPWait for retest the entry level then take a trade for Sell otherwise skip this setup guys

AUDUSD - ANALYSIS👀 Observation:
Hello, everyone! I hope you're doing well. I’d like to share my analysis of AUD-USD (Australian Dollar) with you.
Looking at the chart for AUD-USD, I expect a small pullback towards 0.60878. After reaching this level, I anticipate a price decline towards 0.55325.
📉 Expectation:
Bullish Scenario: A slight pullback to 0.60878
Bearish Scenario: A decline to 0.55325 after reaching the target.
💡 Key Levels to Watch:
Support: 0.55325
Resistance: 0.60878
💬 What do you think about AUD-USD this week? Let me know in the comments!
Trade safe

AUDUSD Analysis Today: Technical and Order Flow Analysis !In this video I will be sharing my AUDUSD analysis today, by providing my complete technical and order flow analysis, so you can watch it to possibly improve your forex trading skillset. The video is structured in 3 parts, first I will be performing my complete technical analysis, then I will be moving to the COT data analysis, so how the big payers in market are moving their orders, and to do this I will be using my customized proprietary software and then I will be putting together these two different types of analysis.

AUDUSD I Weekly CLS , KL - Order Block, Model 2Hey Traders!!
Feel free to share your thoughts, charts, and questions in the comments below—I'm about fostering constructive, positive discussions!
🧩 What is CLS?
CLS represents the "smart money" across all markets. It brings together the capital from the largest investment and central banks, boasting a daily volume of over 6.5 trillion.
✅By understanding how CLS operates—its specific modes and timings—you gain a powerful edge with more precise entries and well-defined targets.
🛡️Follow me and take a closer look at Models 1 and 2.
These models are key to unlocking the market's potential and can guide you toward smarter trading decisions.
📍Remember, no strategy offers a 100%-win rate—trading is a journey of constant learning and improvement. While our approaches often yield strong profits, occasional setbacks are part of the process. Embrace every experience as an opportunity to refine your skills and grow.
Wishing you continued success on your trading journey. May this educational post inspire you to become an even better trader!
“Adapt what is useful, reject what is useless, and add what is specifically your own.”
David Perk ⚔

AUDUSD long/buy 1:5 probabilityHello everyone
* Expanding flat is being formed currently.
* The impulsive wave (1AW) shows the beginning of an uptrend.
* The correction is incomplete until wave C is formed (shown with white line)
* MACD divergence
Entry: CMP
STOP LOSS: 0.62093
TAKE PROFIT: 0.64380
Trade with care.
Note: Focus on losing 1% on a trade only or split it into two trades (0.50% risk on each).
i.e. If the first trade is a loss, enter with another one when your strategy gives you a chance to do so.

Aussie dollar possible reversal In the previous week sellers push price with a strong momentum to a weekly demand zone, the weekly candle showing a sign of reversal.
The battle between the sellers and the buyers still on, can the buyers push price above the last supply zone?
Looking for the reversal to the upside.

AU SELLSAU is bearish. I'd wait for price to form a LH before continuing to take sells towards the weekly low. Preferably wait for price to retrace to the broken support around 0.61300 area before looking for long term sells.

AUD/USD "The Aussie Dollar" Forex Market Heist Plan🌟Hi! Hola! Ola! Bonjour! Hallo! Marhaba!🌟
Dear Money Makers & Robbers, 🤑 💰💸✈️
Based on 🔥Thief Trading style technical and fundamental analysis🔥, here is our master plan to heist the AUD/USD "The Aussie Dollar" Forex market. Please adhere to the strategy I've outlined in the chart, which emphasizes long entry. Our aim is the high-risk Red Zone. Risky level, overbought market, consolidation, trend reversal, trap at the level where traders and bearish robbers are stronger. 🏆💸Book Profits Be wealthy and safe trade.💪🏆🎉
Entry 📈 : "The heist is on! Wait for the MA breakout (0.64000) then make your move - Bullish profits await!"
however I advise to Place Buy stop orders above the Moving average (or) Place buy limit orders within a 15 or 30 minute timeframe most recent or swing, low or high level.
📌I strongly advise you to set an alert on your chart so you can see when the breakout entry occurs.
Stop Loss 🛑:
Thief SL placed at the recent / nearest low level Using the 4H timeframe (0.62800) swing trade basis.
SL is based on your risk of the trade, lot size and how many multiple orders you have to take.
🏴☠️Target 🎯: 0.65500 (or) Escape Before the Target
🧲Scalpers, take note 👀 : only scalp on the Long side. If you have a lot of money, you can go straight away; if not, you can join swing traders and carry out the robbery plan. Use trailing SL to safeguard your money 💰.
AUD/USD "The Aussie Dollar" Forex Market Heist Plan (Day Trade) is currently experiencing a bullishness,., driven by several key factors.
📰🗞️Get & Read the Fundamental analysis, Macro Economics, COT Report, Quantitative Analysis, Intermarket Analysis, Sentimental Outlook, Positioning and future trend...
Before start the heist plan read it.👉👉👉
📌Keep in mind that these factors can change rapidly, and it's essential to stay up-to-date with market developments and adjust your analysis accordingly.
⚠️Trading Alert : News Releases and Position Management 📰 🗞️ 🚫🚏
As a reminder, news releases can have a significant impact on market prices and volatility. To minimize potential losses and protect your running positions,
we recommend the following:
Avoid taking new trades during news releases
Use trailing stop-loss orders to protect your running positions and lock in profits
💖Supporting our robbery plan 💥Hit the Boost Button💥 will enable us to effortlessly make and steal money 💰💵. Boost the strength of our robbery team. Every day in this market make money with ease by using the Thief Trading Style.🏆💪🤝❤️🎉🚀
I'll see you soon with another heist plan, so stay tuned 🤑🐱👤🤗🤩

AUD/USD : Bullish Momentum Builds from Strong DemandIn the 4-hour AUD/USD chart, strong supply and demand zones are visible. A significant demand zone is observed around the 0.62269 level. Within the chart, a Change of Character (ChoCh) is identified from the 0.6323 level, and a Break of Structure (BoS) is noted at the 0.63211 level. A strong selling reaction has been observed from the supply zone, and the market has retested that level again.
On the demand side, the market has touched the strong demand zone twice and showed a bullish formation each time. Currently, the price is forming a strong bullish candle again.
Based on the Fibonacci levels, potential upside targets could be seen at 0.62717, 0.63128, and 0.63312, provided the market holds above the demand zone. However, if the demand zone is broken, there is a possibility of the market dropping down to 0.61901 .

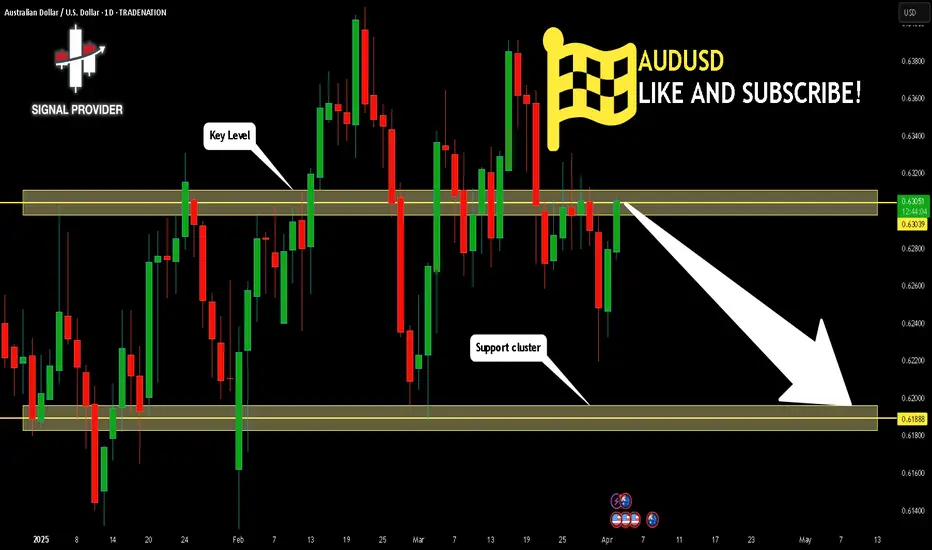
AUDUSD Will Move Lower! Sell!
Take a look at our analysis for AUDUSD.
Time Frame: 1D
Current Trend: Bearish
Sentiment: Overbought (based on 7-period RSI)
Forecast: Bearish
The market is testing a major horizontal structure 0.630.
Taking into consideration the structure & trend analysis, I believe that the market will reach 0.618 level soon.
P.S
The term oversold refers to a condition where an asset has traded lower in price and has the potential for a price bounce.
Overbought refers to market scenarios where the instrument is traded considerably higher than its fair value. Overvaluation is caused by market sentiments when there is positive news.
Disclosure: I am part of Trade Nation's Influencer program and receive a monthly fee for using their TradingView charts in my analysis.
Like and subscribe and comment my ideas if you enjoy them!
AUD/USD "The Aussie" Forex Bank Bearish Heist Plan (Swing/Day)🌟Hi! Hola! Ola! Bonjour! Hallo! Marhaba!🌟
Dear Money Makers & Robbers, 🤑💰✈️
Based on 🔥Thief Trading style technical and fundamental analysis🔥, here is our master plan to heist the AUD/USD "The Aussie" Forex Bank. Please adhere to the strategy I've outlined in the chart, which emphasizes short entry. Our aim is the high-risk Green Zone. Risky level, oversold market, consolidation, trend reversal, trap at the level where traders and bullish robbers are stronger. 🏆💸Book Profits Be wealthy and safe trade.💪🏆🎉
Entry 📈 : "The heist is on! Wait for the MA breakout then make your move at (0.62200) - Bearish profits await!"
however I advise to Place sell stop orders above the Moving average (or) after the MA level Breakout Place sell limit orders within a 15 or 30 minute timeframe most NEAREST (or) SWING low or high level.
📌I strongly advise you to set an "alert (Alarm)" on your chart so you can see when the breakout entry occurs.
Stop Loss 🛑: "🔊 Yo, listen up! 🗣️ If you're lookin' to get in on a sell stop order, don't even think about settin' that stop loss till after the breakout 🚀. You feel me? Now, if you're smart, you'll place that stop loss where I told you to 📍, but if you're a rebel, you can put it wherever you like 🤪 - just don't say I didn't warn you ⚠️. You're playin' with fire 🔥, and it's your risk, not mine 👊."
📌Thief SL placed at the nearest/swing High or Low level Using the 4H timeframe (1.42800) Day/Swing trade basis.
📌SL is based on your risk of the trade, lot size and how many multiple orders you have to take.
Target 🎯: 0.62900 (or) Escape Before the Target
🧲Scalpers, take note 👀 : only scalp on the Short side. If you have a lot of money, you can go straight away; if not, you can join swing traders and carry out the robbery plan. Use trailing SL to safeguard your money 💰.
💸💵AUD/USD "The Aussie" Forex Bank Heist Plan (Swing/Day Trade) is currently experiencing a bearishness,., driven by several key factors.👇
📰🗞️Get & Read the Fundamental, Macro, COT Report, Quantitative Analysis, Sentimental Outlook, Intermarket Analysis, Future trend targets.. go ahead to check 👉👉👉🔗
⚠️Trading Alert : News Releases and Position Management 📰 🗞️ 🚫🚏
As a reminder, news releases can have a significant impact on market prices and volatility. To minimize potential losses and protect your running positions,
we recommend the following:
Avoid taking new trades during news releases
Use trailing stop-loss orders to protect your running positions and lock in profits
💖Supporting our robbery plan 💥Hit the Boost Button💥 will enable us to effortlessly make and steal money 💰💵. Boost the strength of our robbery team. Every day in this market make money with ease by using the Thief Trading Style.🏆💪🤝❤️🎉🚀
I'll see you soon with another heist plan, so stay tuned 🤑🐱👤🤗🤩

LONG ON AUDUSDprice is approaching Daily resistance level, and we are expecting a bounce in the zone

AUDUSD breaking down following the headlinesIntraday Update: The AUDUSD has broken flag support following the headline from China that they are going to impose a 34% retaliatory tariff. The AUDUSD just surpassed the 127% extension and now may target the .6118 level intraday.
Long term targets the post covid lockdown lows.

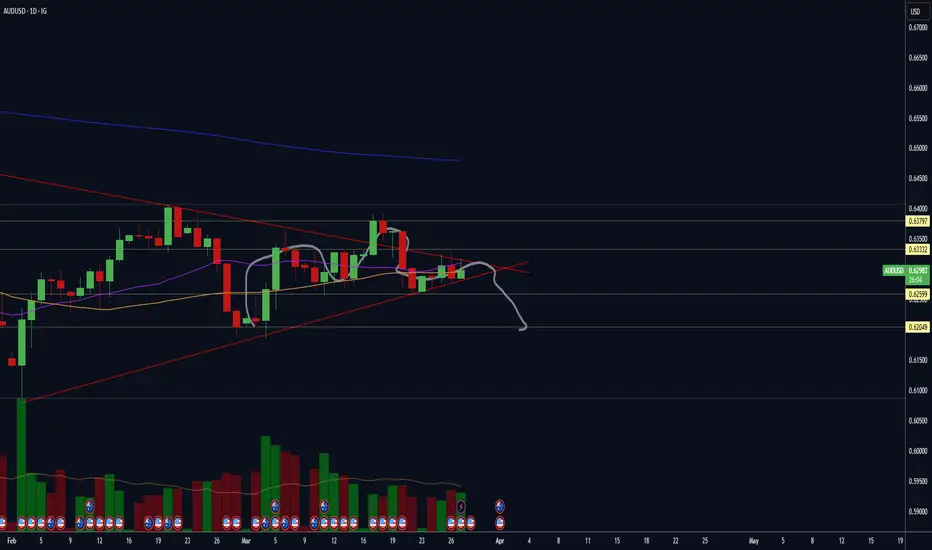
Is the Aussie dropping?The Australian fundamentals are always weak and despite the noise, the US fundamentals are strong (for now). With tariff pressure and US news volume, I think the $AUD/USD could complete the daily head and shoulders. I'm targeting .6200 area.
AUDUSD SELLVoici la version fusionnée et traduite en anglais :
---
**📉 AUDUSD: Ongoing Correction – Where to Enter? 🤔**
On **AUDUSD**, in the **weekly timeframe**, we’ve seen a **break of the key support at 0.635**. Since then, the market has been in a **bullish correction**, following an **ascending trendline**, with several levels already broken to the downside. 📊
📍 **Key Points to Watch:**
🔹 A **potential continuation of the downtrend**, especially if the **USD regains strength** (see **DXY**).
🔹 **Where to enter and where to place the stop?** That’s the big question!
💬 **What’s your take on AUDUSD? Are you ready to follow this move?** Good luck and happy trading! 🚀
---
**📉 AUDUSD: Strong Volatility After Trump’s Speech – Stay Alert!**
Trump’s speech brought a **wave of volatility** to AUDUSD. **We’re closely monitoring how the market reacts** and what key levels come into play next.
🔹 **The big question now:** Will we see a **continuation of the downtrend**, or is this just a technical rebound?
🔹 **What to watch:** The next **H4/Daily closes** to confirm direction.
👀 **Are you already in position on AUDUSD, or are you waiting for more confirmation?** 💬

AUDUSD DRIFTED BY 1.52% WHAT NEXT AHEAD OF NFP? AUDUSD drifted over 1.52% in the Asian trading session! Technically, price is at a button low which provides a good buy opportunity. I anticipate a buy TREND to emerge from the current market price to a pullback resistance of 0.63315

AUDUSD POTENTIAL LONG POSITION Q2 W14 Y25 FRIDAY 4TH APRIL 2025AUDUSD POTENTIAL LONG POSITION Q2 W14 Y25 FRIDAY 4TH APRIL 2025
Could well be the only position to provide fun coupons on a successful week of trading.
The concept is quite simple but does lack a few of our favourite confluences. If this was the beginning of the week, we would perhaps wait for a 15' break of structure but this takes away the Tokyo range fill confluences.
We require a tap into the 15' order block, followed by a bullish move from the point of interest. This in turn we wish to leave behind a void and order block creation. In the same breath, we require lower time frame breaks of structure since the break of 15' would not then give us enough time on an NFP Friday for price action to pull back to the low point of interest and a move long.
Lets see how it plays.
FRGNT x

uptrendIt is expected that the trend will change within the current support area and we will see the beginning of the upward trend.
As long as the price does not stabilize above the green resistance area, the continuation of the downward trend is likely.

Triangle Chart Patterns: How to Identify and Trade ThemTriangle Chart Patterns: How to Identify and Trade Them
Triangle chart patterns are essential tools in technical analysis, helping traders identify potential trend continuations. These formations build as the price consolidates between converging trendlines, signalling an upcoming move in the market. In this article, we’ll explore the three types of triangle patterns—symmetrical, ascending, and descending—and how traders use them to analyse price movements.
What Are Triangle Chart Patterns?
Triangle chart patterns are a common tool used to understand price movements in the market. These patterns form when the price of an asset moves within two converging trendlines, creating a triangle shape on a chart. The lines represent support and resistance levels, and as they get closer together, it signals a potential breakout in one direction.
Symmetrical, ascending, and descending are three types of triangle patterns. Each of these patterns reflects a different market sentiment, with symmetrical triangles showing indecision, ascending triangles suggesting a bullish bias, and descending triangles hinting at bearish momentum. These formations are useful because they help traders spot potential breakouts, where the price might move sharply up or down after a period of consolidation.
It’s important to note that triangles and wedge patterns are similar but not the same. Both patterns involve converging trendlines, but wedges tend to slope upward or downward. Triangles, on the other hand, either feature one horizontal trendline and a sloping trendline or two sloping trendlines at roughly the same angle.
Below, we’ll cover the three triangle types. If you’d like to follow along, head over to FXOpen and TradingView to get started with real-time charts.
Symmetrical Triangle
The symmetrical triangle is a popular chart pattern that shows up when the price of an asset starts consolidating within a tighter range. Unlike other triangle patterns, it doesn’t lean heavily in either direction—bullish or bearish—making it a neutral signal. It forms when buyers and sellers are in a bit of a standoff, with no clear trend in sight. However, this period of indecision often leads to a significant move once the price breaks out of the pattern.
What Does It Look Like?
- Two converging trendlines;
- One sloping down from the highs (resistance);
- One sloping up from the lows (support);
- The price oscillates between these two lines, forming lower highs and higher lows;
- The formation narrows as the lines get closer together, creating a point of breakout.
What Does It Indicate?
A symmetrical triangle pattern indicates a period of indecision in the market. Buyers and sellers are evenly matched, causing the price to move within a narrowing range. As it gets smaller, the pressure builds, and the price is likely to break out either up or down. Since the formation is neutral, the breakout could occur in either direction, and traders wait for this moment to see where the market is heading.
How Do Traders Use It?
Traders typically watch for a breakout from the symmetrical triangle to signal the next significant price movement. They often look for an increase in trading volume alongside the breakout, as this can confirm the strength of the move. In most cases, it’s used as a signal for potential price continuation. However, some traders see it as a reversal indicator, depending on what the preceding trend looks like.
Ascending Triangle
An ascending triangle is a bullish triangle pattern that’s often looked for when analysing potential price breakouts. It usually forms during an uptrend but may also appear in a downtrend. It suggests that buyers are becoming more aggressive, while sellers are struggling to push the price lower, creating a situation where the market might break upwards.
What Does It Look Like?
- A horizontal resistance line at the top (price struggles to break above this level);
A rising trendline at the bottom, connecting higher lows (buyers are stepping in earlier each time);
- The price moves between these two lines, creating a triangle shape;
- The formation narrows over time, putting pressure on the resistance level.
What Does It Indicate?
An ascending triangle pattern signals that buyers are gaining control. While the price keeps hitting a ceiling (resistance), the higher lows show that the market’s buying pressure is increasing. This often leads to a breakout above the resistance level, where the price can make a significant upward move. Traders usually see this formation as a sign that the market is primed for a continuation of the current uptrend. However, sometimes it can appear in a downtrend and signal a trend reversal.
How Do Traders Use It?
Traders typically use the ascending triangle to spot potential breakouts above the resistance level. When the price finally moves and closes above this line, it’s seen as confirmation that the upward trend is continuing. Many also pay close attention to the trading volume during this breakout—rising volume can confirm that the breakout is genuine.
In some cases, the price may break through the resistance quickly, while in others, it could take time before the upward move happens. There may also be false breakouts before the true bullish move occurs, with the price typically closing below resistance.
Descending Triangle
A descending triangle is a bearish chart pattern that signals potential downward movement in the market. It typically forms during a downtrend but can also appear in an uptrend. It shows that sellers are becoming more dominant, while buyers are struggling to push the price higher, which could lead to a breakdown below a key support level.
What Does It Look Like?
- A horizontal support line at the bottom (price struggles to break below this level);
- A descending trendline at the top, connecting lower highs (sellers are pushing the price down);
- The price moves between these two lines, creating a triangle shape;
- The formation narrows over time, with the pressure building on the support level.
What Does It Indicate?
A descending triangle chart pattern suggests that sellers are in control. While the price holds at the support level, the series of lower highs shows that selling pressure is increasing. This often leads to a breakdown below the support line, where the price might experience a sharp decline. Traders see the formation as a bearish signal, indicating that the market could continue its downward trend.
How Do Traders Use It?
Traders typically use the descending triangle to identify potential breakdowns below the support level. When the price falls and closes below this line, it’s considered confirmation that the sellers have taken over and that further downside movement could follow.
Similar to other triangle patterns, it’s common to watch for a rise in trading volume during the breakdown, as it can confirm the strength of the move. It’s also possible to see false breakouts below the support level when the price closes back inside the pattern almost immediately.
How Traders Use Triangle Patterns in Technical Analysis
These patterns are just one piece of the puzzle in technical analysis, but they can offer us valuable insights when used correctly.
Triangle Pattern Trading: Entry, Stop-Loss, and Profit Targets
Entry Points
Traders typically wait for a confirmed breakout from the triangle formation’s boundaries before entering a trade. For ascending triangles, this means watching for the price to break above the upper trendline (resistance), while for descending triangles, they look for a breakdown below the lower trendline (support). In a symmetrical triangle, the breakout may be in either direction, usually informed by the broader market trend.
The entry is often confirmed by a closing candle above or below these key levels to reduce the risk of false breakouts.
Stop-Loss Placement
Stop-loss orders are crucial here. For ascending triangles, stop losses might be placed just below the last swing low, while for descending triangles, they might be set just above the recent swing high. In the case of symmetrical triangles, traders often place the stop-loss just outside the formation’s apex.
Profit Targets
To set profit targets, traders typically use the triangle's height (the distance between the highest and lowest points). This height is then projected from the breakout point, offering a realistic target for the trade. For example, if a triangle stock pattern’s height is $10 and the breakout occurs at $50, the target would be $60 for a bullish move.
Combining with Market Context
Triangles may become more reliable when considered in the context of the broader market environment. Traders don’t just look at the pattern in isolation—they analyse the prevailing trend, market sentiment, and even macroeconomic factors to gauge whether a breakout aligns with the larger market movement. For instance, an ascending formation in a strong uptrend adds confidence to the idea of a bullish breakout.
Using Other Indicators for Confirmation
While triangles provide a useful framework, they’re usually combined with other technical indicators for confirmation. Traders often align triangles with volumes, moving averages, or momentum indicators to assess whether the breakout has strong support behind it. For instance, a breakout confirmed by high volume or a moving average crossover might add confluence to the trade.
Limitations and Considerations of Triangle Patterns
Triangles are useful tools in technical analysis, but they come with limitations and important considerations. While they can signal potential breakouts, it’s essential to approach them cautiously.
- False Breakouts: Triangles often experience false breakouts, where the price briefly moves beyond the trendline but quickly reverses. This may trap traders in unfavourable positions.
- Subjectivity: These formations are open to interpretation. Different people may draw trendlines slightly differently, leading to varying conclusions about where the breakout occurs.
- Need for Confirmation: Relying solely on patterns can be risky. They may work better when combined with other indicators, such as volume or moving averages, to confirm the trend direction.
- Market Conditions: In volatile or news-driven markets, chart patterns may not behave as expected, reducing their reliability. They may provide false signals or lose significance in these situations.
The Bottom Line
Triangle chart patterns are popular tools among those looking to analyse market movements and potential breakouts. Whether it’s a symmetrical, ascending, or descending triangle, these patterns provide valuable insights into price consolidation and future trends. While no pattern guarantees a winning trade, combining triangles with other indicators may improve market analysis.
Ready to apply your knowledge? Open an FXOpen account to explore chart patterns in more than 700 live markets and take advantage of our low-cost, high-speed trading environment backed by advanced trading platforms.
FAQ
What Is a Triangle Chart Pattern?
A triangle chart is a pattern in technical analysis that forms when the price of an asset moves between converging trendlines, creating a triangle shape on a price chart. They typically signal a period of consolidation before a strong potential breakout in price.
What Are the Patterns of Triangles?
There are three main types of triangles in chart patterns: symmetrical, ascending, and descending. Symmetrical triangles indicate indecision in the market while ascending triangles are often bullish, and descending triangles tend to be bearish.
How to Trade a Triangle?
Traders typically wait for a confirmed breakout from the triangle’s trendlines. According to theory, entry points are based on a breakout above resistance or below support, with stop-loss orders placed just outside the triangle. Profit targets are often set based on the height (the distance between the highest and lowest points) of the pattern.
What Is the Triangle Pattern Strategy?
The triangle pattern strategy involves waiting for a breakout and using the formation’s height to set profit targets. It’s combined with tools like volume, moving averages, and momentum indicators to confirm the move and avoid false breakouts.
Is the Triangle Pattern Bullish or Bearish?
They can be both bullish and bearish. Ascending triangles are generally seen before a bullish movement, descending triangles are bearish, and symmetrical triangles can be either.
This article represents the opinion of the Companies operating under the FXOpen brand only. It is not to be construed as an offer, solicitation, or recommendation with respect to products and services provided by the Companies operating under the FXOpen brand, nor is it to be considered financial advice.
