My Thoughts #005My thoughts are that the pair will sell...
The daily trend is very much bullish and with trend once it have made a new High(HH)
We need to see it printing a new Low(HL)
Confirmation?
I see a Consolidation/Accumulation and the market is creating Highs confirmation for the manipulation what would come next would be distribution...
The pair might just continue buying
So use proper risk management
Let's do the most
AUDUSD.P trade ideas

Aussie H4 | Falling toward an overlap supportThe Aussie (AUD/USD) is falling towards an overlap support and could potentially bounce off this level to climb higher.
Buy entry is at 0.6336 which is an overlap support that aligns close to the 23.6% Fibonacci retracement.
Stop loss is at 0.6235 which is a level that lies underneath a pullback support and the 38.2% Fibonacci retracement.
Take profit is at 0.6463 which is a swing-high resistance.
High Risk Investment Warning
Trading Forex/CFDs on margin carries a high level of risk and may not be suitable for all investors. Leverage can work against you.
Stratos Markets Limited (tradu.com):
CFDs are complex instruments and come with a high risk of losing money rapidly due to leverage. 63% of retail investor accounts lose money when trading CFDs with this provider. You should consider whether you understand how CFDs work and whether you can afford to take the high risk of losing your money.
Stratos Europe Ltd (tradu.com):
CFDs are complex instruments and come with a high risk of losing money rapidly due to leverage. 63% of retail investor accounts lose money when trading CFDs with this provider. You should consider whether you understand how CFDs work and whether you can afford to take the high risk of losing your money.
Stratos Global LLC (tradu.com):
Losses can exceed deposits.
Please be advised that the information presented on TradingView is provided to Tradu (‘Company’, ‘we’) by a third-party provider (‘TFA Global Pte Ltd’). Please be reminded that you are solely responsible for the trading decisions on your account. There is a very high degree of risk involved in trading. Any information and/or content is intended entirely for research, educational and informational purposes only and does not constitute investment or consultation advice or investment strategy. The information is not tailored to the investment needs of any specific person and therefore does not involve a consideration of any of the investment objectives, financial situation or needs of any viewer that may receive it. Kindly also note that past performance is not a reliable indicator of future results. Actual results may differ materially from those anticipated in forward-looking or past performance statements. We assume no liability as to the accuracy or completeness of any of the information and/or content provided herein and the Company cannot be held responsible for any omission, mistake nor for any loss or damage including without limitation to any loss of profit which may arise from reliance on any information supplied by TFA Global Pte Ltd.
The speaker(s) is neither an employee, agent nor representative of Tradu and is therefore acting independently. The opinions given are their own, constitute general market commentary, and do not constitute the opinion or advice of Tradu or any form of personal or investment advice. Tradu neither endorses nor guarantees offerings of third-party speakers, nor is Tradu responsible for the content, veracity or opinions of third-party speakers, presenters or participants.

Bullish rise?The Aussie (AUD/USD0 has bounced off the pivot which is an overlap support and could rise to the 1st resistance that lines up with the 127.2% Fibonacci extension.
Pivot: 0.6361
1st Support: 0.6290
1st Resistance: 0.6536
Risk Warning:
Trading Forex and CFDs carries a high level of risk to your capital and you should only trade with money you can afford to lose. Trading Forex and CFDs may not be suitable for all investors, so please ensure that you fully understand the risks involved and seek independent advice if necessary.
Disclaimer:
The above opinions given constitute general market commentary, and do not constitute the opinion or advice of IC Markets or any form of personal or investment advice.
Any opinions, news, research, analyses, prices, other information, or links to third-party sites contained on this website are provided on an "as-is" basis, are intended only to be informative, is not an advice nor a recommendation, nor research, or a record of our trading prices, or an offer of, or solicitation for a transaction in any financial instrument and thus should not be treated as such. The information provided does not involve any specific investment objectives, financial situation and needs of any specific person who may receive it. Please be aware, that past performance is not a reliable indicator of future performance and/or results. Past Performance or Forward-looking scenarios based upon the reasonable beliefs of the third-party provider are not a guarantee of future performance. Actual results may differ materially from those anticipated in forward-looking or past performance statements. IC Markets makes no representation or warranty and assumes no liability as to the accuracy or completeness of the information provided, nor any loss arising from any investment based on a recommendation, forecast or any information supplied by any third-party.

BUY AUDUSDIt looks as though the inverse head and shoulders pattern has matured. I would like to see a reversal towards 0,6444. Let the bears breath

AUD/USD "The Aussie" Forex Bank Money Heist (Bullish)🌟Hi! Hola! Ola! Bonjour! Hallo! Marhaba!🌟
Dear Money Makers & Robbers, 🤑 💰💸✈️
Based on 🔥Thief Trading style technical and fundamental analysis🔥, here is our master plan to heist the AUD/USD "The Aussie" Forex Bank Heist. Please adhere to the strategy I've outlined in the chart, which emphasizes long entry. Our aim is to escape near the high-risk MA Line Zone. It's a Risky level, overbought market, consolidation, trend reversal, trap at the level where traders and bearish robbers are stronger. 🏆💸"Take profit and treat yourself, traders. You deserve it!💪🏆🎉
Entry 📈 : "The heist is on! Wait for the Crossing previous high (0.64900) then make your move - Bullish profits await!"
however I advise to Place Buy stop orders above the Moving average (or) Place buy limit orders within a 15 or 30 minute timeframe most recent or swing, low or high level for Pullback entries.
📌I strongly advise you to set an "alert (Alarm)" on your chart so you can see when the breakout entry occurs.
Stop Loss 🛑: "🔊 Yo, listen up! 🗣️ If you're lookin' to get in on a buy stop order, don't even think about settin' that stop loss till after the breakout 🚀. You feel me? Now, if you're smart, you'll place that stop loss where I told you to 📍, but if you're a rebel, you can put it wherever you like 🤪 - just don't say I didn't warn you ⚠️. You're playin' with fire 🔥, and it's your risk, not mine 👊."
📍 Thief SL placed at the nearest/swing low level Using the 4H timeframe (0.6400) Day trade basis.
📍 SL is based on your risk of the trade, lot size and how many multiple orders you have to take.
🏴☠️Target 🎯: 0.65800
🧲Scalpers, take note 👀 : only scalp on the Long side. If you have a lot of money, you can go straight away; if not, you can join swing traders and carry out the robbery plan. Use trailing SL to safeguard your money 💰.
💰💵💸AUD/USD "The Aussie" Forex Bank Money Heist is currently experiencing a bullishness,., driven by several key factors. .☝☝☝
📰🗞️Get & Read the Fundamental, Macro Economics, COT Report, Quantitative Analysis, Sentimental Outlook, Intermarket Analysis, Future trend targets with overall score... go ahead to check👉👉👉🔗🔗🌎🌏🗺
⚠️Trading Alert : News Releases and Position Management 📰🗞️🚫🚏
As a reminder, news releases can have a significant impact on market prices and volatility. To minimize potential losses and protect your running positions,
we recommend the following:
Avoid taking new trades during news releases
Use trailing stop-loss orders to protect your running positions and lock in profits
💖Supporting our robbery plan 💥Hit the Boost Button💥 will enable us to effortlessly make and steal money 💰💵. Boost the strength of our robbery team. Every day in this market make money with ease by using the Thief Trading Style.🏆💪🤝❤️🎉🚀
I'll see you soon with another heist plan, so stay tuned 🤑🐱👤🤗🤩

AUDUSD: Short Signal with Entry/SL/TP
AUDUSD
- Classic bearish formation
- Our team expects pullback
SUGGESTED TRADE:
Swing Trade
Short AUDUSD
Entry - 0.6477
Sl - 0.6503
Tp - 0.6429
Our Risk - 1%
Start protection of your profits from lower levels
Disclosure: I am part of Trade Nation's Influencer program and receive a monthly fee for using their TradingView charts in my analysis.
❤️ Please, support our work with like & comment! ❤️

AUDUSD Bulls LoadingWe will see some strong bullish moves on this pair later today. Price has created a reversal patter, an inverse head and shoulders pattern.

AUDUSD BEARISH AUD/USD Bearish Divergence – Sell Setup Pending Confirmation
Description:
AUD/USD is showing signs of weakness as a bearish divergence forms between price and RSI/MACD on the H1/H4 chart. While price makes higher highs, momentum indicators are printing lower highs — suggesting a potential shift in momentum.
🔽 Trade Setup:
Entry: Sell Stop below recent swing low at
Stop Loss: Above recent high at
Take Profit 1: – Prior support zone
Take Profit 2: – Extended fib target or next major support
Risk/Reward: Minimum 1:2 R/R
📉 Technical Confluence:
Bearish Divergence (RSI/MACD)
Key Resistance Zone holding
Rejection Candles / Wicks on higher timeframe
Structure potentially forming Lower High
🔔 Trade Plan:
Waiting for confirmation via sell stop trigger to avoid premature entries. Patience is key — only act if price breaks the structure with momentum. Monitor price action closely around the entry zone.
📊 Timeframe: H1 / H4
📍 Market Bias: Short-term Bearish

AUDUSD SELL (USD NFP NEWS FRDAY TOMORROW)As the chart looks its building resistance with many wicks, we can most likely see AUDUSD will drop tomorrow as Non-Farm Payroll from USD. It does not seem it will push up as I thought to expect to break the resistance, but still keep a good watch on it.
Take Profit: 0.634 or below

AUDUSD Sell IdeaMarket Become Lazy and It's Seems that they Will Retrace to Down Side Cuz The Trend was the Up But We Can Catuch A Scalp Or Daytrade there. Look.

AUD/USD Ready To Give Us A Second Entry With Extra 250 Pips !Here is my second area to can enter a buy trade on AUD/USD , First Entry +90 Pips , now i`m looking for second entry , we have a very good breakout after long time , so it will be my fav place to add another entry and targeting another 250 pips , just waiting for touch and good bullish price action to confirm my analysis .

GBP/JPY Short, GBP/USD Short, AUD/CAD Short and AUD/USD ShortGBP/JPY Short
Minimum entry requirements:
• If structured 1H continuation forms, 1H risk entry within it.
GBP/USD Short
Minimum entry requirements:
• Corrective tap into area of value.
• 4H risk entry or 1H risk entry after 2 x 1H rejection candles.
Minimum entry requirements:
• Tap into area of value.
• 1H impulse down below area of value.
• If tight non-structured 5 min continuation follows, reduced risk entry on the break of it.
• If tight structured 5 min continuation follows, reduced risk entry on the break of it or 5 min risk entry within it.
• If tight non-structured 15 min continuation follows, 5 min risk entry within it if the continuation is structured on the 5 min chart or reduced risk entry on the break of it.
• If tight structured 15 min continuation follows, reduced risk entry on the break of it or 15 min risk entry within it.
AUD/CAD Short
Minimum entry requirements:
• 1H impulse down below area of value.
• If tight non-structured 15 min continuation follows, 5 min risk entry within it if the continuation is structured on the 5 min chart or reduced risk entry on the break of it.
• If tight structured 15 min continuation follows, reduced risk entry on the break of it or 15 min risk entry within it.
AUD/USD Short
Minimum entry requirements:
• 1H impulse down below area of interest.
• If tight non-structured 15 min continuation follows, 5 min risk entry within it if the continuation is structured on the 5 min chart or reduced risk entry on the break of it.
• If tight structured 15 min continuation follows, reduced risk entry on the break of it or 15 min risk entry within it.

AUDUSD Potential DownsidesHey Traders, in tomorrow's trading session we are monitoring AUDUSD for a selling opportunity around 0.64100 zone, AUDUSD is trading in a downtrend and currently is in a correction phase in which it is approaching the trend at 0.64100 support and resistance area.
Trade safe, Joe.

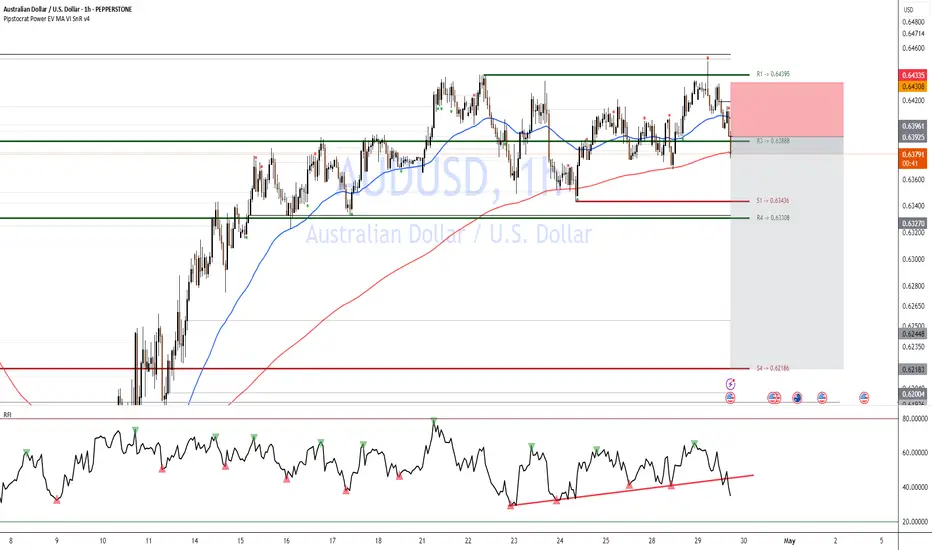
AUSSIE bearish move Short-setup: Breakdown of Support (AUD/USD)
Trigger: Price has decisively broken below R3 (0.63888) and the 200-hour MA (red) on the 1h chart.
Confirmation: RFI just dipped below its ascending trendline and failed to reclaim it—momentum is bearish.
Entry: Short at market 0.6385–0.6380 (just below R3).
Initial Stop: Above R1 (0.64395) ≈ 55 pips stop.
Targets:
T1: S1 (0.63436) (~40 pips → RRR ≈ 1 : 0.7)
T2: R4 (0.63308) (~55 pips → RRR ≈ 1 : 1)
⚡ Highlight: This is a bank-order-flow style fade—selling the break of minor support after a test of the 200-hour MA confluence.
🔑 Rationale
Support→Resistance flip at R3 gives logical entry & SL.
200-hour MA rejection confirms sellers overpowering buyers.
RFI confirms sustained bearish momentum.
High RRR (>1:1) ensures edge even with moderate win-rate.
Australian CPI Surprise: What It Means for the RBA & AUD/USDMatt Simpson breaks down the latest Australian inflation data and what it could mean for the Reserve Bank of Australia’s next move. Plus, we dive into the AUD/USD, AUD/CAD, GBP/AUD and EUR/AUD charts for key technical setups traders need to watch right now.

AUDUSD potential bullrunI am expecting from the weekly timeframe to form the wick that means the retracement from 2h timeframe and in the zone of AOI daily to have a shift of structure then continue to the upside, We'll see!
DISCLAIMER! The information and publications are not meant to be, and do not constitute, financial, investment, trading, or other types of advice or recommendations supplied or endorsed by me.

possibity of uptrendThe price is expected to stabilize above the resistance level, then continue the upward trend. Then there is a possibility of breaking the resistance range.

AUDUSD H1 I Bullish Bounce Off 61.8% Fibo Based on the H1 chart analysis, the price is falling toward our buy entry level at 0.6417, a pullback support that aligns with the 61.8% Fibonacci retracement.
Our take profit is set at 0.6488, a swing high resistance.
The stop loss is placed at 0.6355, a swing high resistance.
High Risk Investment Warning
Trading Forex/CFDs on margin carries a high level of risk and may not be suitable for all investors. Leverage can work against you.
Stratos Markets Limited (tradu.com):
CFDs are complex instruments and come with a high risk of losing money rapidly due to leverage. 63% of retail investor accounts lose money when trading CFDs with this provider. You should consider whether you understand how CFDs work and whether you can afford to take the high risk of losing your money.
Stratos Europe Ltd (tradu.com):
CFDs are complex instruments and come with a high risk of losing money rapidly due to leverage. 63% of retail investor accounts lose money when trading CFDs with this provider. You should consider whether you understand how CFDs work and whether you can afford to take the high risk of losing your money.
Stratos Global LLC (tradu.com):
Losses can exceed deposits.
Please be advised that the information presented on TradingView is provided to Tradu (‘Company’, ‘we’) by a third-party provider (‘TFA Global Pte Ltd’). Please be reminded that you are solely responsible for the trading decisions on your account. There is a very high degree of risk involved in trading. Any information and/or content is intended entirely for research, educational and informational purposes only and does not constitute investment or consultation advice or investment strategy. The information is not tailored to the investment needs of any specific person and therefore does not involve a consideration of any of the investment objectives, financial situation or needs of any viewer that may receive it. Kindly also note that past performance is not a reliable indicator of future results. Actual results may differ materially from those anticipated in forward-looking or past performance statements. We assume no liability as to the accuracy or completeness of any of the information and/or content provided herein and the Company cannot be held responsible for any omission, mistake nor for any loss or damage including without limitation to any loss of profit which may arise from reliance on any information supplied by TFA Global Pte Ltd.
The speaker(s) is neither an employee, agent nor representative of Tradu and is therefore acting independently. The opinions given are their own, constitute general market commentary, and do not constitute the opinion or advice of Tradu or any form of personal or investment advice. Tradu neither endorses nor guarantees offerings of third-party speakers, nor is Tradu responsible for the content, veracity or opinions of third-party speakers, presenters or participants.

AUD/USD Faces Resistance Rejection – Short Setup in Play!Timeframe: 1-Hour Chart
Analyzing intraday to short-term movement in AUD/USD.
Entry Zone (Supply Area):
Price entered the resistance zone near 0.64160 – 0.64200, indicating a potential short entry.
Bearish Rejection:
Strong wick rejection from resistance suggests sellers are active at that level.
Stop-Loss (Red Box Top):
Placed just above the resistance at 0.64296, guarding against false breakouts.
Target Zone (Demand Area):
Marked near 0.63560 – 0.63600, indicating a potential take profit level.
Risk-Reward Ratio:
The green (reward) area is significantly larger than the red (risk), showing a favorable risk-to-reward setup.
Trend Bias:
Overall bearish structure with lower highs and lower lows, supporting short trade bias.
Trigger Confirmation:
Price rejected resistance and started falling, indicating short trade activation.

AUDUSD InsightHello to all our subscribers!
Please feel free to share your personal opinions in the comments. Don’t forget to hit the Booster and subscribe!
Key Points
- Ukrainian President Volodymyr Zelensky stated, “We all want this war to end fairly. There should be no rewards for Putin—especially not territorial concessions.”
- As trade negotiations between the United States and China remain stalled, U.S. Treasury Secretary Scott Bessent warned that China bears responsibility for the tariffs and could lose up to 10 million jobs if the tariffs persist.
- U.S. Commerce Secretary Howard Lutnick said in an interview with CNBC, “We already have a finalized agreement, but we must wait for approval from their prime minister and parliament.”
- The Trump administration officially announced a temporary two-year suspension of tariffs on foreign auto parts used in vehicles manufactured within the United States.
This Week's Major Economic Calendar
+ April 30: Germany Q1 GDP, Germany April Consumer Price Index (CPI), U.S. April ADP Non-Farm Employment Change, U.S. March Core Personal Consumption Expenditures (PCE) Price Index
+ May 1: Bank of Japan Interest Rate Decision
+ May 2: Eurozone April CPI, U.S. April Non-Farm Payrolls (NFP), U.S. April Unemployment Rate
AUDUSD Chart Analysis
Although a downward reversal was initially anticipated, the pair continues to test upper resistance levels. For a clearer directional outlook, it must either break through the resistance above or fall below the 0.63000 level.
- If the upper resistance is broken, a rise toward the 0.68000 level is expected.
- Conversely, if the price breaks below 0.63000, a decline toward the 0.60000 level is likely.

AUDUSD SHORT FORECAST Q2 W18 D29 Y25AUDUSD SHORT FORECAST Q2 W18 D29 Y25
Professional Risk Managers👋
Welcome back to another FRGNT chart update📈
Diving into some Forex setups using predominantly higher time frame order blocks alongside confirmation breaks of structure.
Let’s see what price action is telling us today!
💡Here are some trade confluences📝
✅Weekly 50 EMA
✅Intraday 15' order block
✅Tokyo ranges to be filled
✅Intraday 15' order block trading levels
🔑 Remember, to participate in trading comes always with a degree of risk, therefore as professional risk managers it remains vital that we stick to our risk management plan as well as our trading strategies.
📈The rest, we leave to the balance of probabilities.
💡Fail to plan. Plan to fail.
🏆It has always been that simple.
❤️Good luck with your trading journey, I shall see you at the very top.
🎯Trade consistent, FRGNT X

AUD-USD Will Keep Growing! Buy!
Hello,Traders!
AUD-USD started the trading
Week with a strong bullish
Move up from the horizontal
Support of 0.6371 while trading
In an uptrend so we are bullish
Biased mid-term and we will
Be expecting a further bullish
Continuation, but its best to
Wait and see how the price
Interacts with the local
Key level of 0.6439 as
We might see a local
Pullback from this supply
Area giving us a better
Entry price for the long
Buy!
Comment and subscribe to help us grow!
Check out other forecasts below too!
Disclosure: I am part of Trade Nation's Influencer program and receive a monthly fee for using their TradingView charts in my analysis.

no clear momentum yet - keep within the trend line🔔🔔🔔 AUD/USD news:
➡️ The Australian Dollar is slightly lower on Tuesday after recording a gain of more than 0.50% against the US Dollar in the previous session. The AUD/USD pair lost ground as the US Dollar gained amid easing global trade tensions.
➡️ However, the newly released US JOLTS Job Openings data is negative for the USD and could limit the decline of AUD/USD
Personal opinion:
➡️ USD/CAD will remain within the trend line and wait for strong enough news to break out of the safe zone in the coming time
➡️ Analysis based on resistance - support levels and trend lines combined with EMA to come up with a suitable strategy
Personal plan:
🔆Price Zone Setup:
👉 Buy AUD/USD 0.6385 - 0.6395
❌SL: 0.6340 | ✅TP: 0.6430
FM wishes you a successful trading day 💰💰💰
