AUDUSD Price ActionHello Traders,
Liquidity is what makes supply and demand zones truly powerful. As you can see, I've marked both the supply and demand areas—each supported by clear liquidity levels on both sides.
With that structure in place, we can now look for long opportunities, but always with proper risk management in mind.
Just remember: No Liquidity = No Zone Confirmation.
Keep it simple, stick to the rules.
Good luck and happy trading!
AUDUSD.P trade ideas

Technical Analysis of AUDUSD: Weakness Ahead of Central Bank MeeIn the previous analysis, we noted the decline in this currency pair, though a temporary rebound led to a retest of the supply zone before another drop. Investor caution regarding potential retaliatory tariffs announced by U.S. President Donald Trump, scheduled for Wednesday as "Freedom Day," has added further pressure on the Australian dollar. As a result, the likelihood of a deeper decline toward the 0.60 demand zone remains intact.

AUDUSD Order BlockIn the AUDUSD order block, vwap supports this and can come to the places I marked respectively. This is not investment advice

AUDUSD: Long Trade with Entry/SL/TP
AUDUSD
- Classic bullish setup
- Our team expects bullish continuation
SUGGESTED TRADE:
Swing Trade
Long AUDUSD
Entry Point - 0.6221
Stop Loss - 0.6186
Take Profit - 0.6287
Our Risk - 1%
Start protection of your profits from lower levels
Disclosure: I am part of Trade Nation's Influencer program and receive a monthly fee for using their TradingView charts in my analysis.
❤️ Please, support our work with like & comment! ❤️

That trend line looks juicy!Interesting structure...
Remember that a crowded area is a pending liquidity zone.
Don't forget that patience pays off!
Apply your own strategy to find the entry, or here's a little setup, that's what I'm waiting for...
Keep it simple!
Don't forget to follow me...

AUDUSD SELL 106 PIPS LIVE EXCAUTION AND EDUCATIONAL BREAKDOWN AUD/USD has ereased earlier gains to edge lower below 0.6300 in the Asian session on Monday. Trump's tariff concerns outweigh mixed Chinese NBS March PMI data, Australia's hot private inflation data and broad US Dollar weakness, exerting downward pressure on the pair as risk-aversion intensifies.

AUDUSD Neutral Bias with Key Support at 0.6250Trend Overview:
AUDUSD remains in a sideways trading range, indicating a neutral sentiment. Recent price action suggests a corrective pullback toward a previous consolidation zone, now acting as a key support at 0.6250.
Key Levels:
Support: 0.6250 (key level), 0.6200, 0.6140
Resistance: 0.6324, 0.6360, 0.6390
Bullish Scenario:
A bounce from 0.6250 would confirm support and may trigger an upside move. A breakout above 0.6324 could extend gains toward 0.6360 and 0.6390 over the longer term.
Bearish Scenario:
A daily close below 0.6250 would weaken the outlook, increasing the likelihood of a retracement toward 0.6200, with 0.6140 as the next downside target.
Conclusion:
AUDUSD remains neutral within a range, with a key level at 0.6250. A bullish bounce could target 0.6324, 0.6360, and 0.6390, while a break below 0.6250 may shift momentum toward 0.6200 and 0.6140. Traders should watch price action at 0.6250 for confirmation of the next move.
This communication is for informational purposes only and should not be viewed as any form of recommendation as to a particular course of action or as investment advice. It is not intended as an offer or solicitation for the purchase or sale of any financial instrument or as an official confirmation of any transaction. Opinions, estimates and assumptions expressed herein are made as of the date of this communication and are subject to change without notice. This communication has been prepared based upon information, including market prices, data and other information, believed to be reliable; however, Trade Nation does not warrant its completeness or accuracy. All market prices and market data contained in or attached to this communication are indicative and subject to change without notice.

AUDUSDLast week on AUDUSD we took a 2% loss totaling 2.8% lost on phase 2 so far. Crazy part is our bias last week was completely right and we caught a good entry but price just wasn't quite ready to fall like it has been recently. We are now looking for a retracement back into the zone to then look for a entry depending on the confluences we see show itself.

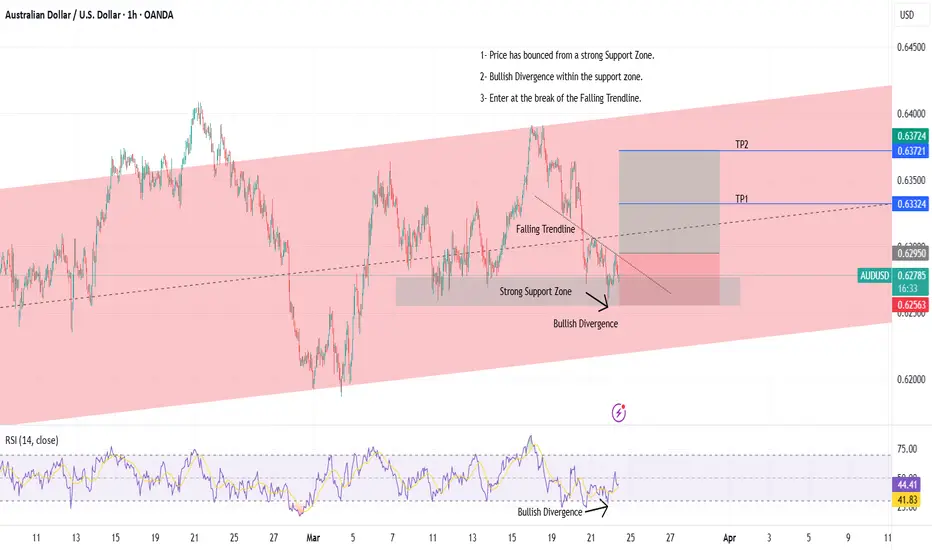
24-03-2025 _ Short Term Bullish Idea _ AUDUSD H11- Price has bounced from a strong Support Zone.
2- Bullish Divergence within the support zone.
3- Enter at the break of the Falling Trendline.
AUD/USD For Bearishyou can go short now
or
wait for pull-back near by entry point and then go short
have fun :)

Market Analysis: AUD/USD Struggles to Sustain Gains—What’s Next?Market Analysis: AUD/USD Struggles to Sustain Gains—What’s Next?
AUD/USD declined below the 0.6320 and 0.6300 support levels.
Important Takeaways for AUD/USD Analysis Today
- The Aussie Dollar started a fresh decline from well above the 0.6320 level against the US Dollar.
- There is a connecting bearish trend line forming with resistance at 0.6300 on the hourly chart of AUD/USD at FXOpen.
AUD/USD Technical Analysis
On the hourly chart of AUD/USD at FXOpen, the pair struggled to clear the 0.6330 zone. The Aussie Dollar started a fresh decline below the 0.6300 support against the US Dollar, as discussed in the previous analysis.
The pair even settled below 0.6280 and the 50-hour simple moving average. There was a clear move below 0.6270. A low was formed at 0.6269 and the pair is now consolidating losses.
On the upside, an immediate resistance is near the 0.6295 level and the 61.8% Fib retracement level of the downward move from the 0.6312 swing high to the 0.6269 low.
There is also a connecting bearish trend line forming with resistance at 0.6300. It is close to the 76.4% Fib retracement level of the downward move from the 0.6312 swing high to the 0.6269 low. The next major resistance is near the 0.6310 zone, above which the price could rise toward 0.6320.
Any more gains might send the pair toward the 0.6330 resistance. A close above the 0.6330 level could start another steady increase in the near term. The next major resistance on the AUD/USD chart could be 0.6380.
On the downside, initial support is near the 0.6270 zone. The next support sits at 0.6260. If there is a downside break below 0.6260, the pair could extend its decline. The next support could be 0.6200. Any more losses might send the pair toward the 0.6165 support.
This article represents the opinion of the Companies operating under the FXOpen brand only. It is not to be construed as an offer, solicitation, or recommendation with respect to products and services provided by the Companies operating under the FXOpen brand, nor is it to be considered financial advice.

AUDUSD I Monday CLS Range I KL - OB I Model 2Hey Traders!!
Feel free to share your thoughts, charts, and questions in the comments below—I'm about fostering constructive, positive discussions!
🧩 What is CLS?
CLS represents the "smart money" across all markets. It brings together the capital from the largest investment and central banks, boasting a daily volume of over 6.5 trillion.
✅By understanding how CLS operates—its specific modes and timings—you gain a powerful edge with more precise entries and well-defined targets.
🛡️Follow me and take a closer look at Models 1 and 2.
These models are key to unlocking the market's potential and can guide you toward smarter trading decisions.
📍Remember, no strategy offers a 100%-win rate—trading is a journey of constant learning and improvement. While our approaches often yield strong profits, occasional setbacks are part of the process. Embrace every experience as an opportunity to refine your skills and grow.
Wishing you continued success on your trading journey. May this educational post inspire you to become an even better trader!
“Adapt what is useful, reject what is useless, and add what is specifically your own.”
David Perk ⚔

There is no reason not to be bullish here!!!This is a good zone. I timed the market so you dont have to.
Enjoy this wonderful swing. There is no other liquidity in the downside so we go only up

AUDUSD Technical AnalysisFenzoFx—AUD/USD broke below the critical support at $0.626, heading toward the 78.6% Fibonacci level. The bearish trend remains intact while the price stays below the $0.6329 resistance.

DeGRAM | AUDUSD growth in the channelAUDUSD is in an ascending channel between the trend lines.
The price is moving from the lower boundary of the channel.
The chart formed a harmonic pattern and held the 62% retracement level.
We expect the growth to continue in the channel.
-------------------
Share your opinion in the comments and support the idea with like. Thanks for your support!

Check the trend A trend change is expected to form within the current support area and we will see the start of an uptrend. If the price breaks through the support area, a continuation of the downtrend is likely.

AUDUSD Analysis: Reversal Predictions Based on Trading MathDear Trader,
Please find attached my analysis of $Subject, which uses mathematical calculations to identify potential reversal times and price levels.
The analysis details projected south and north price targets (horizontal lines on the chart), along with estimated time frames for possible reversals (vertical lines on the chart, accurate to within +/- 1-2 candles). To increase the probability of these analysis, I recommend monitoring the 5-minute and 15-minute charts for the following key reversal candlestick patterns:
Doji’s
Hammer/Inverted Hammer
Double/Triple Bottom/Top
Shooting Star
Morning Star
Hanging Man
I welcome your feedback on this analysis, as it will inform and enhance my future research.
Regards,
Shunya Trade
Vertical Line time
31st March 04:30 PM
31st March 06:15 PM 07:30 PM
1st Apr 01:30 AM
1st Apr 04:30 AM 06:15 AM
1st Apr 10:30 AM
1st Apr 12:15 PM 01:30 PM
2nd Apr 01:30 AM
2nd Apr 04:30 AM 06:15 AM
2nd Apr 07:30 AM
2nd Apr 10:30 PM
3rd Apr 01:30 AM
⚠️ Disclaimer:
This post is educational content and does not constitute investment advice, financial advice, or trading recommendations. The views expressed here are based on technical analysis and are shared solely for informational purposes. The stock market is subject to risks, including capital loss, and readers should exercise due diligence before investing. We do not take responsibility for decisions made based on this content. Consult a certified financial advisor for personalized guidance.

BUY AUDUSD, you wont regret it!GBPUSD has already left, you can continue adding positions to it but AUDUSD hasn't moved much yet that's why I'm picking it.
I'm makin the stops really small due to the AUD been weak now, but dont worry, it wont be hit.
My TPs are the purple line
Follow me as my trades are market order and not limit orders. You will get notification once I post if you follow so you will enter the trade on time.

Week of 3/30/25: AUDUSD Weekly AnalysisWeekly analysis this week, price has been congesting and tightening the last 2 weeks, expecting hopefully a good move this week to breakout of consolidation.
Starting the week with a bearish bias.
Major News: NFP Friday
Thanks for stopping by, have a great trading week!

AudUsd Trade IdeaAU has been in an overall range between 64000 and 61363. Price ended up respecting 64000 once more before getting into a bearish range after the structure flip. I'm personally looking for price to break from the range to confirm our overall bearish move back down to 61363.

AUDUSD Potential SellsFX:AUDUSD is definitely interesting rn. I can see AU selling to the 0.6200 area based of H4/Daily head & shoulders pattern. If price breaks daily support/head & shoulders neckline, then that'll give me more confirmation to look for sells.

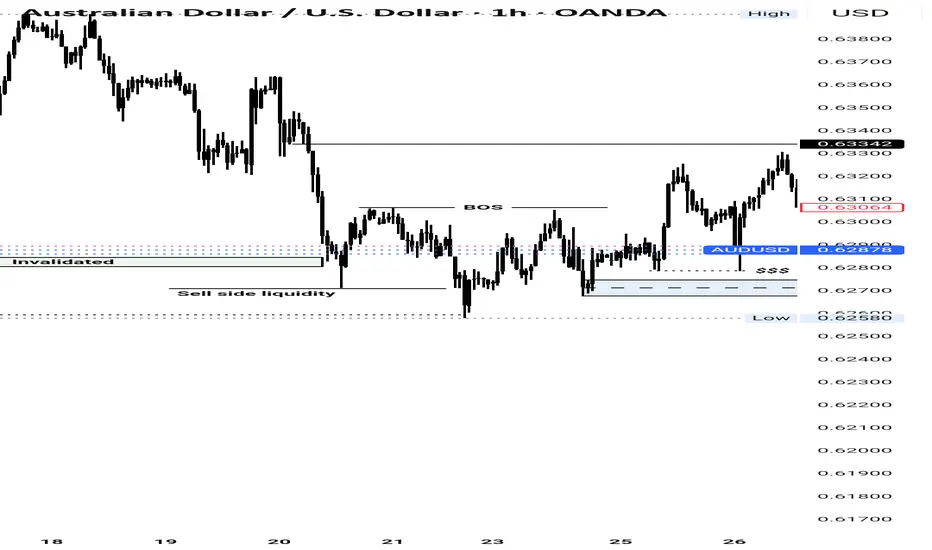
AUDUSD POSSIBLE BUY When price came to our POI on the M30 it wasn't respected instead we got a sweep of liquidity of that leg, nonetheless the demand zone on the M30 was seen on the 1H which makes it invalidated. After the sweep we got a push up, well price has been ranging for awhile. On the Hourly we're seeing a clear price action so in summary since we've seen a BOS on the hourly and liquidity below before POI, my expectation is if price respects our POI I'll be looking for long.
AUDUSD 1HPrice initially moved up as expected but retraced later in the week.
Given upcoming news, a breakout and confirmation beyond the 27-pip range will determine the trading direction. For now, staying neutral is preferable, but I remain cautiously bullish in line with the previous analysis.
