AUDUSD LONG ReboundAUDUSD Rebound, we have bullish confirmation, the price jumped up from the 1h orderblock.
AUDUSD.P trade ideas

15 minute Trendline breakThe price broke out of the trendline and now the price looks to make a lower low. Time to go short
WE ONLY TRADE PULLBACKS

AUDUSD MONTHLY DIRECTION 25 MARCH 2025 / AUDUSD MONTHLY ( SWING POSITION)
as in the chart above. i can see that march already make its highest level during two first week of march and climb down all the way down to support zone since beginning of third week and the closing price is in support zone ( purple support zone).
important points
1) month already make its highest price.
2) and climb down to the support zone = retracement.
3) at the support zone in 12H timeframe, we can see that price reacted bullish engulfing at support zone.
4) this bullish engulfing happened at lower equidistant channel line.
5) strong and Good technical analysis tools confluence.
entry:
entry at support zone with 60-70 pips stoploss.
take profit set to 140 pips which is measured in RRR will be 1:2 ( it can be more than that)
possibility that price go against analysis.
1) i dont involve much in fundamental analysis but im sure that in a monthly timeframe analysis or swing position. since this analysis is for april movement. yes! Many high impact news probably can effect this analysis.

Buy AUDUSDaudusd making a series of high and also retrace from 1 day trend line we can enter here and make good profit.

AUDUSD INTRADAY consolidation range support retest at 0.6260The AUDUSD currency pair is exhibiting bullish sentiment, driven by the prevailing uptrend. The recent intraday price action indicates a corrective pullback towards a previous resistance zone, which has now transformed into new support. This pattern suggests that the pair may be consolidating before resuming its upward momentum.
Key Trading Levels:
Support Level: The critical support level to monitor is 0.6260, representing the previous consolidation price range.
Upside Targets: A corrective pullback from current levels, followed by a bullish rebound from the 0.6260 level, could set the stage for an upward move targeting resistance levels at 0.6356, followed by 0.6408 and 0.6440 over a longer timeframe.
Alternative Bearish Scenario:
A confirmed break and daily close below the 0.6260 support level would negate the bullish outlook, potentially signaling a deeper retracement. In this scenario, the pair could move towards the support levels at 0.6220, 0.6190, and 0.6170.
Conclusion:
The current sentiment remains bullish, with the 0.6260 level acting as a pivotal support point. A successful bounce from this level could reaffirm the uptrend and prompt further bullish continuation. Conversely, a breakdown and close below this support would signal a potential bearish shift, warranting caution and possible repositioning.
This communication is for informational purposes only and should not be viewed as any form of recommendation as to a particular course of action or as investment advice. It is not intended as an offer or solicitation for the purchase or sale of any financial instrument or as an official confirmation of any transaction. Opinions, estimates and assumptions expressed herein are made as of the date of this communication and are subject to change without notice. This communication has been prepared based upon information, including market prices, data and other information, believed to be reliable; however, Trade Nation does not warrant its completeness or accuracy. All market prices and market data contained in or attached to this communication are indicative and subject to change without notice.

AUDUSDLast week we ended up taking a -0.83% loss due to impatience. Lesson learned and now we are on to a new week. Only one pair on the watchlist but it is a good one! All timeframes in sync. Price at the zone and EMA. With price clearly bearish and the move into the zone already happened we are just looking for a entry signal.

AUDUSD BUYWe have a specific type of divergence on the 1-hour timeframe ⏳, indicating a potential drop 📉 in the higher timeframe. On the other hand, the lower 15-minute timeframe 🕒 gives us a buying perspective 📈. So, the analysis will be as shown in the image.
#audusd #ForexTrading #PriceAction #ForexSignals #TradingAnalysis 💹

AUDUSD Trade IdeaFor supply & demand trader, here is question for you guys. If you guys served to two available supply zone like here, what would you do? Are you going to risk to take two trade at both supply zone? With this situation normally I will watch how the price approaching the zone. Once it tap into the zone, I will look for confirmation, break of structure at the same timeframe or lower.
Have a good trading week guys.


Buy AudusdStill buy expected
Bullish correction necessary
Following the uper trend channel
Monthly still oversold

AUD/USD - Short Term Buy/Long Term Sell?!Long Term BEARISH!
Long Term we are selling, although we could be looking for smaller short term buy positions into the supply zone or possible to hold further.
Currently we have sellers momentum in the 6H TF, I would be possbily looking to trade up into the supply whilst holding sellers momentum for a counter trend trade before possibly looking to sell into sell side liquidity
Price is currently in a range but also a Bullish parralel channel meaning we are consolidating on the Higher TF meaning we are going to be getting a price run soon
Just which supply will that be and how will we spot it, follow me and find out. Will be updating this trade plan this week

AUD/USD (15M) Analysis – 24-03-2025📊 AUD/USD (15M) Analysis – 24-03-2025
📉 Current Price: 0.62781
🟢 Demand Zone (Support): 0.62586 - 0.62742 – Potential area for bullish reaction.
🔴 Supply Zones (Resistance):
0.63219 – First target zone.
0.63628 – Key resistance level.
📌 Market Outlook:
Price is within a bullish order block inside the demand zone.
Scenario 1: If price holds above 0.62742, expect a move towards 0.63219 (TP1) and 0.63628 (TP2).
Scenario 2: If price breaks below 0.62586, bearish momentum may continue.
⚡ Trade Setup:
🔻 Buy Setup: If bullish confirmation at 0.62586 - 0.62742
🎯 TP1: 0.63219
🎯 TP2: 0.63628
🛑 SL: Below 0.62550
#AUDUSD #ForexTrading #SmartMoney #PriceAction #TechnicalAnalysis

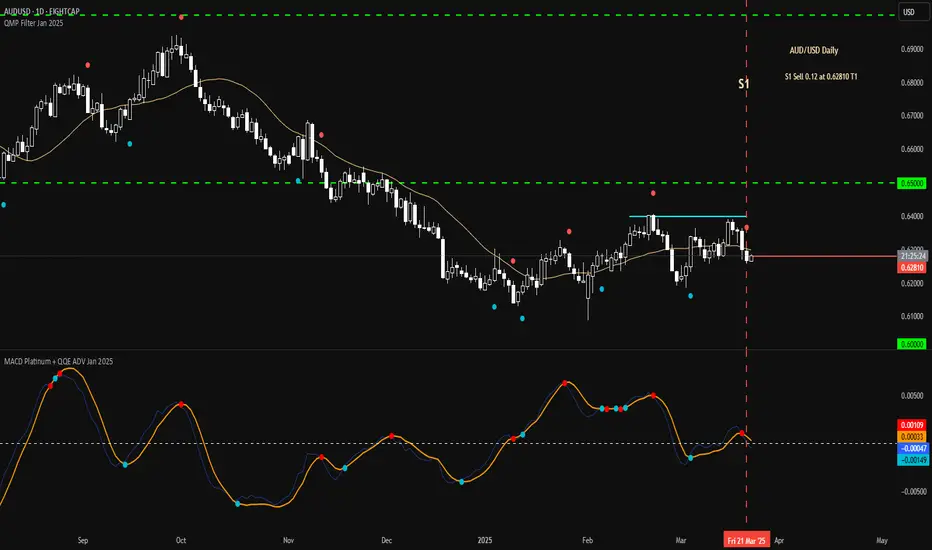
AUSUSDChart of the Week - AUD/USD Daily
There is a lack of trend in the current AUD/USD price action.
Instead, price appears to be moving within a range from 0.6200 to 0.6400
In the centre of the range is a daily support of 0.6277 which price closed below on Friday.
Potentially, this could now mean further downside towards the bottom of the range.

AUDUSD Potential SellAUDUSD is forming a Channel Down and we're expecting it to fall towards the bottom trendline. Look for SELL opportunities.

AUD/ USD - Playing the Bullish Wave with Precision The 4H is holding bullish structure, but liquidity and the order block (OB) haven’t been tapped yet. That doesn’t stop the play—I’m riding the bullish continuation on lower timeframes until price tells me otherwise.
Dropping to the 30M, I’ve spotted a clean OB mitigation. Now, it’s all about refinement—switching to the 5M, waiting for a clear CHoCH, and letting price retrace back into the OB after liquidity is taken. No chasing, just precise execution. Let’s see how it plays out.
Bless Trading!

AUDUSD(20250324)Today's AnalysisToday's buying and selling boundaries:
0.6278
Support and resistance levels:
0.6326
0.6308
0.6297
0.6260
0.6248
0.6230
Trading strategy:
If the price breaks through 0.6278, consider buying, the first target price is 0.6297
If the price breaks through 0.6260, consider selling, the first target price is 0.6248

Mon 24th Mar 2025 AUD/USD Daily Forex Chart Sell SetupGood morning fellow traders. On my Daily Forex charts using the High Probability & Divergence trading methods from my books, I have identified a new trade setup this morning. As usual, you can read my notes on the chart for my thoughts on this setup. The trade being a AUD/USD Sell. Enjoy the day all. Cheers. Jim
Week of 3/23/25: AUDUSD AnalysisAnalysis of my main pair AUDUSD, last week resulted in the bears taking over and my analysis explains why my bias is bearish going into the new week.
Not much volatile news except for Unemployment Claims on Thursday.
Let me know what you guys think, your analysis, and if you want to see anything else!
Goodluck this week traders, let's kill it.

AUDUSD Selling Trading IdeaHello Traders
In This Chart AUDUSD HOURLY Forex Forecast By FOREX PLANET
today AUDUSD analysis 👆
🟢This Chart includes_ (AUDUSD market update)
🟢What is The Next Opportunity on AUDUSD Market
🟢how to Enter to the Valid Entry With Assurance Profit
This CHART is For Trader's that Want to Improve Their Technical Analysis Skills and Their Trading By Understanding How To Analyze The Market Using Multiple Timeframes and Understanding The Bigger Picture on the Chart

Bullish bounce?AUD/USD is falling towards the support level which is an overlap support that line sup with the 71% Fibonacci retracement and could bounce from this level to our take profit.
Entry: 0.6248
Why we like it:
There is an overlap support level that lines up with the 71% Fibonacci retracement.
Stop loss: 0.6203
Why we like it:
There is a pullback support level.
Take profit: 0.6305
Why we like it:
There is a pullback resistance level.
Enjoying your TradingView experience? Review us!
Please be advised that the information presented on TradingView is provided to Vantage (‘Vantage Global Limited’, ‘we’) by a third-party provider (‘Everest Fortune Group’). Please be reminded that you are solely responsible for the trading decisions on your account. There is a very high degree of risk involved in trading. Any information and/or content is intended entirely for research, educational and informational purposes only and does not constitute investment or consultation advice or investment strategy. The information is not tailored to the investment needs of any specific person and therefore does not involve a consideration of any of the investment objectives, financial situation or needs of any viewer that may receive it. Kindly also note that past performance is not a reliable indicator of future results. Actual results may differ materially from those anticipated in forward-looking or past performance statements. We assume no liability as to the accuracy or completeness of any of the information and/or content provided herein and the Company cannot be held responsible for any omission, mistake nor for any loss or damage including without limitation to any loss of profit which may arise from reliance on any information supplied by Everest Fortune Group.

Idea for a trade.AUD/USD trades near the 0.6270 region, failing to recover ground amid persistent USD strength.
A soft Australian labor market report and safe-haven demand for the US Dollar continue to weigh on the Aussie.
Technical indicators point to further downside as the pair remains below key moving averages.
The AUD/USD pair remained depressed during the American session below the 0.6300 barrier as a stronger US Dollar (USD) and disappointing employment data from Australia continued to weigh. Technical signals have turned increasingly bearish, as indicators deteriorate and price action breaks below important moving averages.

audusd|foxforexAUD USD is about to touch the rising trend. As a result of the reaction, it will rise to the yellow trend.

AUDUSD LongAUDUSD Long:
The pair is currently on strong support line and expected to bounce from the resistance level so
Buy: Only if the price sustains above 0.63144 with strong volume confirmation, targeting a move toward 0.63500. Use a tight stop-loss below 0.62803.
Sell: If the price rejects resistance at 0.63144 (e.g., forms a bearish candlestick like a shooting star or double top) or breaks below 0.62803, targeting a retest of lower support (e.g., 0.62500).
