AUDUSD — Potential Long SetupThere’s a key level at 0.6449, which the price is currently approaching. Be mindful of major economic events — they increase uncertainty and can significantly affect the setup.
Invalidation: if price starts to drop below 0.6410.
Target: a breakout above 0.6449.
AUDUSD.P trade ideas

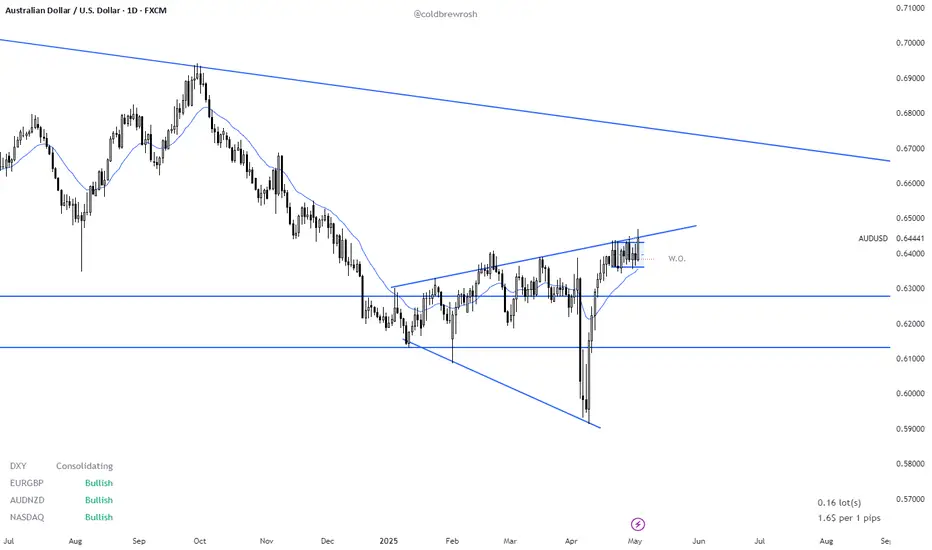
AUD/USD, Are Bull Set for a Breakout ?This analysis dates from the 3rd of May, this is in no way financial advice and should be taken into account in an objective way. Make your own opinion about it, don't take it for granted.
- AUD/USD is trading around the 0.64000 area on the daily chart, it has been consolidating around that area since April 21st following a 7 consecutive bull rally. Where it is heading to next still needs to be determined. Nevertheless, there is a clear Expanding Triangle dating since the start of 2025. (see image attached),(13th January, 03rd of Feb, 09th of April for the lower bar and 27 January, 20th Feb, 17th March, 23rd of April for the upside channel).
- This expanding triangle is similar to the one identified on NZD/USD which had an upside breakout and is now consolidating around the 0.59200.
- Whether there is an upcoming BO on Aussie Dollar is still TBT, but odds slightly favor the bulls following the strong rally in the first half of April. Nevertheless, it has been trading in a trading range since April 21st and there are no confirmed breakout yet. Needs to be closely watched in the coming days!! If bulls manage to get consecutive strong bull bars, this could set the stage for an measured move up for at a minimum a test of the 0.66000 area (downside channel from Feb 2021 to Nov 2024 on the Monthly).
- The Bear reversal case is harder to argue for, as they only managed to get one strong bear bar (04th April), with no follow through selling, The market has been trading for longer on the upper bracket of the extending triangle which means the market participant agree more on higher prices. Stay tuned for further updates !! Peace.

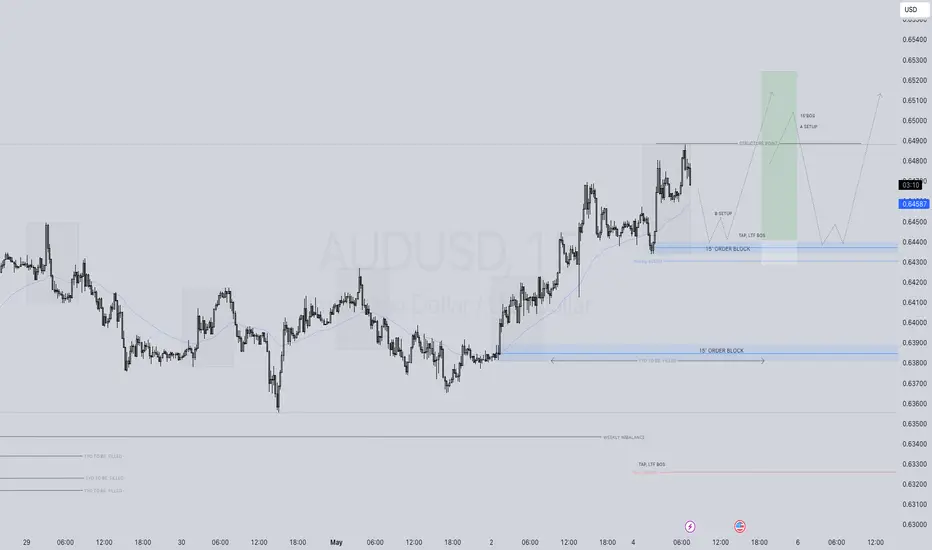
AUDUSD READY TO LAUNCH: HTF Bias + OB + FVG + PRIME SETUPBias:
We’re operating within a clear bullish higher time frame bias, confirmed by previous swing structure and continuous displacement to the upside. Price has consistently made higher highs and higher lows on the 4H and Daily chart.
Entry Zone:
✅ 4H Fair Value Gap (FVG) — a clean imbalance from prior bullish displacement. Price has now retraced into this inefficiency, a key area where smart money typically looks to re-accumulate.
✅ 1H Order Block (OB) — precisely overlapping the 4H FVG, strengthening the setup. This is the last bearish candle before the bullish move that created a market structure shift, now acting as a support zone.
This dual confluence—FVG + OB at a retracement level—marks a premium setup.

Australian dollar hits five-month high after Australian electionThe Australian dollar continues to impress and has posted strong gains on Monday. European session, AUD/USD is trading at 0.6491, up 0.72% on the day and its highest level since early December 2025.
Prime Minister Anthony Albanese cruised to a resounding victory in Saturday's national election. Albanese' centre-left Labor Party increased its majority and thumped the Liberal Party opposition. The coalition's defeat was marked by its leader, Peter Dutton losing his own seat.
The long shadow of US President Donald Trump was a factor in the election. Dutton adopted right-wing policies such as promising tougher immigration laws and establishing a platform to reduce the waste of public funds. The similarities between Dutton and Trump hurt the Liberal leader as many voters were upset with Trump's 10% tariffs on Australia.
At the start of the year, Albanese was trailing badly in the opinion polls. However, he struck a receptive chord among voters on domestic issues such as health care and housing, and benefited from the anti-Trump sentiment, which proved to be a winning recipe.
US nonfarm payrolls, a key gauge of the US labor market, dipped slightly to 177 thousand in April, down from a revised 185 thousand in March. This easily beat the market estimate of 130 thousand. The positive unemployment report points to a resilient labor market which remains strong despite the US economy declining in the first quarter.
The markets have responded by lowering the odds of a rate hike in June to 33%, down sharply from 60% a week ago, according to the CME's FedWatch. The Federal Reserve meets on Wednesday and is virtually certain to maintain the benchmark rate of 4.25%-4.5%.

A Simple breakdown on AUDUSD Let's take a closer look and see how indecisive the AUDUSD is gonna be going back and forth and from my Analysis I'll be capitalizing from every move of the price ...

Bearish Look for potential Reversal bearish candlestick formation upon the retest of daily supply zone.

AUDUSD LONG FORECAST Q2 W19 D5 Y25
AUDUSD LONG FORECAST Q2 W19 D5 Y25
Professional Risk Managers👋
Welcome back to another FRGNT chart update📈
Diving into some Forex setups using predominantly higher time frame order blocks alongside confirmation breaks of structure.
Let’s see what price action is telling us today!
💡Here are some trade confluences📝
✅Weekly 50 EMA
✅Intraday 15' order block
✅Tokyo ranges to be filled
✅Intraday bullish breaks of structure to be confirmed
🔑 Remember, to participate in trading comes always with a degree of risk, therefore as professional risk managers it remains vital that we stick to our risk management plan as well as our trading strategies.
📈The rest, we leave to the balance of probabilities.
💡Fail to plan. Plan to fail.
🏆It has always been that simple.
❤️Good luck with your trading journey, I shall see you at the very top.
🎯Trade consistent, FRGNT X
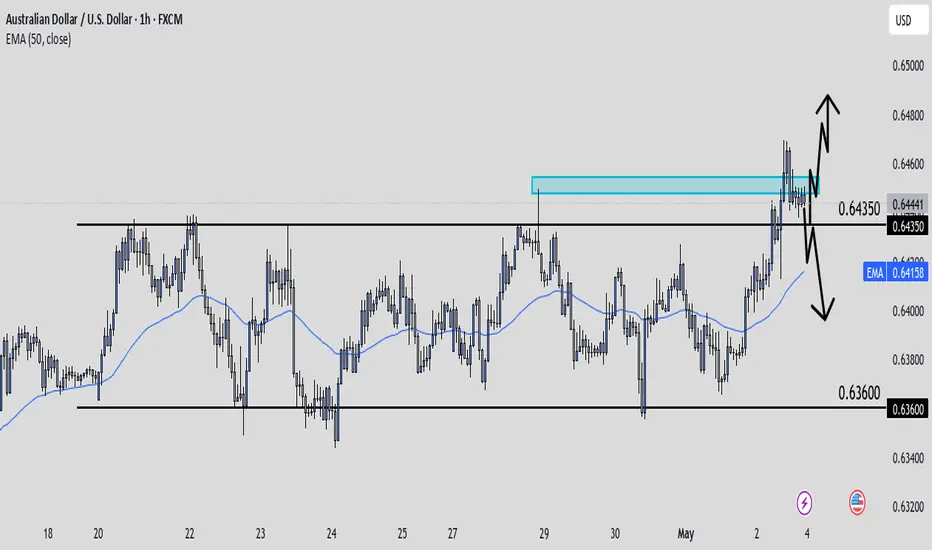
AudUsd Trade IdeaAU is showing a clear range between 64350 and 63600. With last weeks higher time frame closing below the previous high at 64500 I would want to see smaller frames shifting bearish below 64350 to confirm our move to the downside where 63600 could potentially get smacked again in the range continuation.
Continue to decrease today and wait for US-China negotiations🔔🔔🔔 AUD/USD news:
➡️ The AUD/USD pair traded below the 0.6400 level, hovering near its weekly low reached earlier on Friday amid mixed signals. The US Dollar remained firm near a one-month high after the Federal Reserve paused with a hawkish tone on Wednesday, putting downward pressure on the pair.
➡️ This movement occurred as market sentiment improved regarding US-China trade relations ahead of upcoming weekend talks, while the announcement of a new US-UK trade agreement also contributed to the US Dollar’s strength.
Personal opinion:
➡️ The DXY has a third consecutive day of gains and shows no signs of stopping due to support from positive US news. Therefore, AUD/USD will continue to be under pressure in the short term. And wait for positive news from the US-China negotiations.
➡️ However, AUD/USD is oversold and there will be a technical pullback before the pair continues its downtrend
➡️ Analyze based on resistance - support levels combined with trend lines and EMA to come up with a suitable strategy
Personal Plan:
🔆Price Zone Setup:
👉Sell AUD/USD 0.6410 - 0.6420
❌SL: 0.6440 | ✅TP: 0.6355
FM wishes you a successful trading day 💰💰💰

AUD USD and HH to LH.Your message indicates that AUD/USD (Australian Dollar vs. US Dollar) is showing a transition from a Higher High (HH) to a Lower High (LH) — a potentially bearish shift in market structure.

AUD vs Majors: Diverging Paths in a Tumultuous Cycle (2019–2025)The Australian Dollar (AUD) has significantly diverged in performance across major currency pairs since 2019. The AUD/JPY (yellow line) stands out with a strong +14.01% gain, reflecting both risk-on sentiment and yen weakness. Meanwhile, AUD/USD and AUD/CAD have both suffered steep declines of -10.24% and -8.85%, respectively, underlining AUD’s vulnerability to global tightening cycles and commodity-related headwinds. Notably, AUD/NZD has remained relatively flat, highlighting the tight correlation between the two regional economies.
This divergence suggests that AUD’s performance is being increasingly shaped by its counterpart's macro narrative—whether it's U.S. monetary policy, Japanese yield control, or New Zealand's economic synchronization.

AUDUSD looking Bullish?!!Hello traders I hope you are having a wonderful week!!!
We have this wonderful resistance which we broke out of and now we might be looking at buys.
This resistance has also been a market high for a few days now.
That white line there is my Pivot for next week and it serves as a great spot to put my SL.

possibity of uptrendThe price is expected to stabilize above the resistance level, then continue the upward trend. Then there is a possibility of breaking the resistance range.

AUDUSD SHORT FORECAST Q2 W18 D2 Y25AUDUSD SHORT FORECAST Q2 W18 D2 Y25
Professional Risk Managers👋
Welcome back to another FRGNT chart update📈
Diving into some Forex setups using predominantly higher time frame order blocks alongside confirmation breaks of structure.
Let’s see what price action is telling us today!
💡Here are some trade confluences📝
✅Weekly 50 EMA
✅Intraday 15' order block
✅Tokyo ranges to be filled
✅Intraday 15' order block trading levels
🔑 Remember, to participate in trading comes always with a degree of risk, therefore as professional risk managers it remains vital that we stick to our risk management plan as well as our trading strategies.
📈The Xrest, we leave to the balance of probabilities.
💡Fail to plan. Plan to fail.
🏆It has always been that simple.
❤️Good luck with your trading journey, I shall see you at the very top.
🎯Trade consistent, FRGNT

AUDUSD SELL (USD NFP NEWS FRDAY TOMORROW)As the chart looks its building resistance with many wicks, we can most likely see AUDUSD will drop tomorrow as Non-Farm Payroll from USD. It does not seem it will push up as I thought to expect to break the resistance, but still keep a good watch on it.
Take Profit: 0.634 or below

BUY AUDUSDIt looks as though the inverse head and shoulders pattern has matured. I would like to see a reversal towards 0,6444. Let the bears breath

My Thoughts #003 I can see that the pair pushed higher. Invalidating my last post.
But I still see sells and here is how?
As you can see the pair made a high and you can see it took out the most recent low that made that high signalling that the pair has choch and I am enter based on this confluence.
1: A choch and Breakout of the trendline.
2: the market went to the most recent supply zone and cleared the equal highs.
The market can invalidate the set up so use proper risk management
Let's do the most.

AUDUSDAUDUSD – Short Setup
Initiated a short position at 0.64061 following supply zone reaction and bearish momentum on the lower timeframes.
🔹 Entry: 0.64061
🔹 Stop Loss: 0.64503
🔹 Target: 0.62677
This setup aligns with a rejection of prior structure and a possible continuation toward the March support zone. Watching for follow-through confirmation with volume and lower highs.
📚 Shared for educational purposes only. Not financial advice.

AUD/USD Breakout Done , Should We Buy To Get 150 Pips ?Here is my opinion about AUD/USD , If we checked 4H Timeframe , we will see that we have a clear breakout and the price closed above my C.T.L , So i`m looking to buy this pair and targeting 150 pips , but i will enter with small lot size cuz this week is very risky due to monthly closure .

Bullish rise?The Aussie (AUD/USD0 has bounced off the pivot which is an overlap support and could rise to the 1st resistance that lines up with the 127.2% Fibonacci extension.
Pivot: 0.6361
1st Support: 0.6290
1st Resistance: 0.6536
Risk Warning:
Trading Forex and CFDs carries a high level of risk to your capital and you should only trade with money you can afford to lose. Trading Forex and CFDs may not be suitable for all investors, so please ensure that you fully understand the risks involved and seek independent advice if necessary.
Disclaimer:
The above opinions given constitute general market commentary, and do not constitute the opinion or advice of IC Markets or any form of personal or investment advice.
Any opinions, news, research, analyses, prices, other information, or links to third-party sites contained on this website are provided on an "as-is" basis, are intended only to be informative, is not an advice nor a recommendation, nor research, or a record of our trading prices, or an offer of, or solicitation for a transaction in any financial instrument and thus should not be treated as such. The information provided does not involve any specific investment objectives, financial situation and needs of any specific person who may receive it. Please be aware, that past performance is not a reliable indicator of future performance and/or results. Past Performance or Forward-looking scenarios based upon the reasonable beliefs of the third-party provider are not a guarantee of future performance. Actual results may differ materially from those anticipated in forward-looking or past performance statements. IC Markets makes no representation or warranty and assumes no liability as to the accuracy or completeness of the information provided, nor any loss arising from any investment based on a recommendation, forecast or any information supplied by any third-party.

AUDUSD - BULL FLAG (Bullish)🧠 Technical Overview
Pair: AUD/USD
Timeframe: 4H
Current Price: ~0.63864
General Structure:
Strong prior uptrend leading into a consolidation phase.
Price is forming a classic bull flag pattern (bullish continuation).
Fibonacci extension levels are plotted from the recent impulse leg to project targets.
🔥 Pattern Analysis
Bull Flag:
Parallel, downward-sloping channel following a strong bullish move, indicating healthy retracement.
Price is currently testing the upper boundary of the flag (~0.6394).
Breakout Plan:
Break and close above the flag resistance would confirm bullish continuation.
Immediate target lies at 0.6508 (previous structure high and 1.0 Fibonacci extension).
Higher Fibonacci extension targets are located at:
1.618 Fib ≈ 0.6553
2.0 Fib ≈ 0.6573
2.618 Fib ≈ 0.6622
🔍 Indicators
(Indicators not shown in the image, but inferred from price action):
A breakout supported by higher volume would strengthen confirmation.
RSI pushing above 60 would further confirm bullish momentum.
🧩 Summary
Bias: Bullish
Key triggers:
A strong breakout and close above 0.6394–0.6400.
Retest and continuation move would offer a more conservative entry.
Risk:
Caution required if breakout occurs on low volume.
Invalidation of the setup if price falls below 0.6380 (flag base) or decisively below 0.6318 (key structural support).
✍️ Quick Trade Plan Example
Setup Details
Entry Break and close above 0.6400
Stop Loss Below 0.6380 (or tighter below 0.6368)
Take Profit 1 0.6508
Take Profit 2 0.6553
Take Profit 3 0.6622
Final tip:
If price breaks out impulsively, aggressive entries can be considered. If the breakout is slow and grinding, it would be safer to wait for a pullback and a confirmed bullish rejection.

AUD/USD Inflation Data Crucial for RBA Decision. Key Supply ZoneThe AUD/USD exchange rate is approaching a key supply zone on the weekly chart, a region where significant long positions are concentrated. This presents a potential reversal point for the currency pair. Adding to the market's focus is the imminent release of Australia's inflation data on Wednesday. This report will be crucial in shaping expectations for the Reserve Bank of Australia's (RBA) next policy move. Market forecasts generally point towards a 25-basis-point interest rate cut in May, a decision likely driven by concerns over the potential economic fallout from recently imposed US tariffs. The upcoming inflation data will be closely scrutinized to confirm or challenge these anticipated policy adjustments. The confluence of technical analysis (the supply zone) and macroeconomic factors (the inflation report and RBA considerations) makes this a potentially pivotal week for AUD/USD.
✅ Please share your thoughts about AUD/USD in the comments section below and HIT LIKE if you appreciate my analysis. Don't forget to FOLLOW ME; you will help us a lot with this small contribution.
