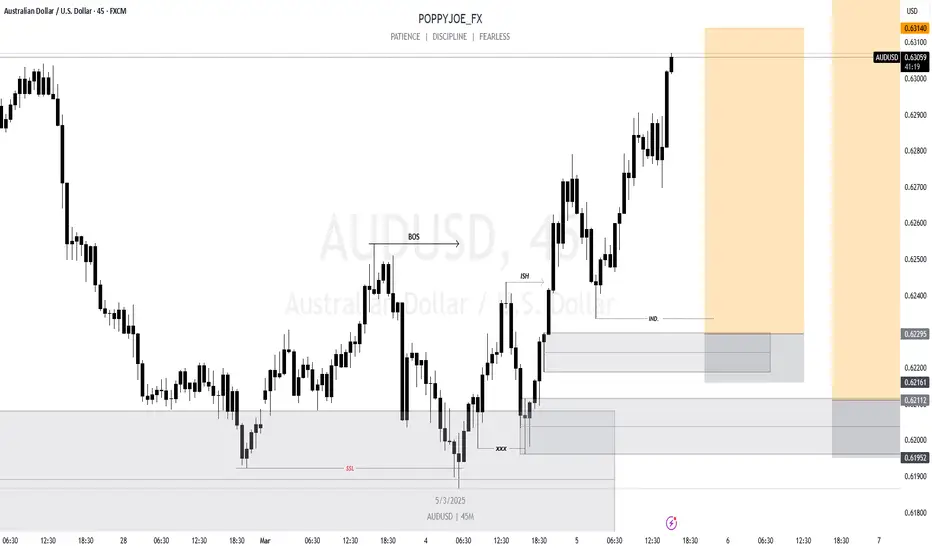
AUD/USD Reversing? Major Buy Signal on H4 Chart
AUD/USD is showing strong bullish momentum after bouncing from a key support zone near 0.61760. The price has broken above the 50-period moving average, indicating a potential trend reversal. A long position has been entered with:
🔹 Entry: 0.63494
🔹 Stop Loss (SL): 0.61760
🔹 Take Profit (TP): 0.66570
If the bullish momentum continues, AUD/USD could target 0.66570 in the coming days. Watch for further confirmations!
💬 What’s your outlook on AUD/USD? Bullish or Bearish? Comment below! 👇
#AUDUSD #ForexTrading #PriceAction #ICT #MarketAnalysis #TradingView
AUDUSD.P trade ideas

Bull flag trade Bull flag spotted on the 30m Timeframe for AUDUSD, take advantage of dollar weakness.


AUD/USD Long Trade IdeaAUD/USD Long Trade Idea
Considering a long position on AUD/USD, supported by the following fundamental and technical factors:
Fundamental Factors:
Commodity Prices: Australia's economy is heavily reliant on commodity exports. Recent stability in commodity prices, particularly iron ore and coal, supports the Australian dollar, as sustained demand from key trading partners maintains export revenues.
Monetary Policy Outlook: The Reserve Bank of Australia (RBA) has maintained a steady monetary policy stance, contrasting with the U.S. Federal Reserve's recent indications of a more cautious approach to future rate hikes. This divergence could favor the AUD over the USD.
Technical Factors:
Support Levels: The AUD/USD pair has shown resilience around the 0.6270 level, suggesting a strong support zone that could provide a foundation for a bullish move.
Moving Averages: The pair is attempting to break above the 9-day exponential moving average (EMA), indicating increasing short-term momentum.
Elliott Wave Analysis: The 4-hour chart highlights a bullish trend, with the market currently in an impulsive mode, suggesting potential for further upside.
Given these factors, a long position on AUD/USD appears favorable. As always, ensure proper risk management and stay updated with economic developments that could impact this trade.
Note: All trading strategies involve risk, and past performance is not indicative of future results.

AUD/USD "The Aussie" Forex Market Heist Plan🌟Hi! Hola! Ola! Bonjour! Hallo! Marhaba!🌟
Dear Money Makers & Robbers, 🤑💰🐱👤🐱🏍
Based on 🔥Thief Trading style technical and fundamental analysis🔥, here is our master plan to heist the AUD/USD "The Aussie" Forex market. Please adhere to the strategy I've outlined in the chart, which emphasizes long entry. Our aim is the high-risk Red Zone. Risky level, overbought market, consolidation, trend reversal, trap at the level where traders and bearish robbers are stronger. 🏆💸Book Profits Be wealthy and safe trade.💪🏆🎉
Entry 📈 : "The vault is wide open! Swipe the Bullish loot at any price - the heist is on!
however I advise to Place buy limit orders within a 15 or 30 minute timeframe most recent or swing, low or high level. I Highly recommended you to put alert in your chart.
Stop Loss 🛑:
Thief SL placed at the recent / swing low level Using the 4H timeframe (0.62000) swing trade basis.
SL is based on your risk of the trade, lot size and how many multiple orders you have to take.
Target 🎯:
Primary Target - 0.64500 (or) Escape Before the Target
Secondary Target - 0.66000 (or) Escape Before the Target
🧲Scalpers, take note 👀 : only scalp on the Long side. If you have a lot of money, you can go straight away; if not, you can join swing traders and carry out the robbery plan. Use trailing SL to safeguard your money 💰.
📰🗞️Read the Fundamental, Macro, COT Report, Quantitative Analysis, Intermarket Analysis, Sentimental Outlook before start the plan.
AUD/USD "The Aussie" Forex Market market is currently experiencing a bullish trend,., driven by several key factors.
🟠Fundamental Analysis
Australian Economic Growth: Australia's economic growth is expected to remain steady, driven by the country's strong mining sector.
US Economic Growth: The US economic growth is expected to slow down, due to the ongoing trade tensions and weak domestic demand.
Interest Rate Differential: The interest rate differential between Australia and the US is expected to narrow, with Australia's interest rate at 3.1% and the US interest rate at 5.25%.
🟣Macro Economics
Inflation Rate: Australia's inflation rate is expected to remain steady at 2.5%, while the US inflation rate is expected to decrease to 2.2%.
Unemployment Rate: Australia's unemployment rate is expected to remain steady at 3.7%, while the US unemployment rate is expected to increase to 3.7%.
Global Trade: The ongoing trade tensions between the US and China are expected to have a minimal impact on the AUD/USD market.
🟡Global Market Analysis
Forex Market: The global forex market is experiencing a moderate increase in volatility, with the AUD/USD pair experiencing a 0.5% increase in the last 24 hours.
Commodity Market: The global commodity market is experiencing a moderate increase, with iron ore prices increasing by 1.2% in the last 24 hours.
Stock Market: The global stock market is experiencing a moderate decrease, with the S&P 500 index decreasing by 0.3% in the last 24 hours.
🔵COT Data
Speculators (Non-Commercials): 60,000 long positions and 40,000 short positions.
Hedgers (Commercials): 40,000 long positions and 60,000 short positions.
🟠Intermarket Analysis
Correlation with NZD/USD: AUD/USD has a positive correlation with NZD/USD, indicating that a strong New Zealand dollar could boost AUD/USD prices.
Correlation with Commodities: AUD/USD has a positive correlation with commodities, indicating that an increase in commodity prices could boost AUD/USD prices.
🟣Quantitative Analysis
Moving Averages: The 50-day moving average is at 0.62600, and the 200-day moving average is at 0.61800.
Relative Strength Index (RSI): The RSI is at 54, indicating a neutral market sentiment.
🔴Market Sentiment Analysis
The overall sentiment for AUD/USD is neutral, with a mix of positive and negative predictions.
58% of client accounts are long on this market, indicating a bullish sentiment.
🟢Positioning
The long/short ratio for AUD/USD is currently 1.2.
The open interest for AUD/USD is approximately 150,000 contracts.
🟡Next Trend Move
Bullish Prediction: Some analysts predict a potential bullish move, targeting 0.64000 and 0.64500, due to the interest rate differential and the weak dollar.
Bearish Prediction: Others predict a potential bearish move, targeting 0.62500 and 0.62000, due to the ongoing trade tensions and the strong dollar.
🔵Real-Time Market Feed
As of the current time, AUD/USD is trading at 0.63300, with a 0.5% increase in the last 24 hours.
⚪Future Prediction
Short-Term: Bullish: 0.63800-0.64300, Bearish: 0.62800-0.62300
Medium-Term: Bullish: 0.64800-0.65300, Bearish: 0.61800-0.61300
Long-Term: Bullish: 0.66300-0.66800, Bearish: 0.60300-0.59800
🟤Overall Summary Outlook
The market is expected to experience a moderate fluctuation, with some analysts predicting a potential bullish move targeting 0.64000 and 0.64500.
📌Keep in mind that these factors can change rapidly, and it's essential to stay up-to-date with market developments and adjust your analysis accordingly.
⚠️Trading Alert : News Releases and Position Management 📰 🗞️ 🚫🚏
As a reminder, news releases can have a significant impact on market prices and volatility. To minimize potential losses and protect your running positions,
we recommend the following:
Avoid taking new trades during news releases
Use trailing stop-loss orders to protect your running positions and lock in profits
💖Supporting our robbery plan 💥Hit the Boost Button💥 will enable us to effortlessly make and steal money 💰💵. Boost the strength of our robbery team. Every day in this market make money with ease by using the Thief Trading Style.🏆💪🤝❤️🎉🚀
I'll see you soon with another heist plan, so stay tuned 🤑🐱👤🤗🤩

AUDusd sell tradeWe are currently in a bearish trend and now we’ve pulled back to our extreme orderblock in the 1hr time frame and have given a 15min internal ChOCh and currently I’m short targeting previous low

Longing AUDaily showing strong bullish candle
4h's order flow is bullish and potential internal range to external range move
1h: liquidity purge, entry below opening, SMT w NU

AUDUSD BULLISH AUDUSD bullish in h1 after break the last LH
rsi divergence in h1
wait for to break the HH
we used buy stop for entry

AUDUSD InsightHello, dear subscribers!
Please share your personal opinions in the comments. Don't forget to like and subscribe!
Key Points
- U.S. Secretary of Commerce Howard Lutnick stated that President Trump is listening to proposals from Canada and Mexico. He mentioned that by April 2, relief measures may be considered for certain market sectors, adding that the tariff exemption could apply to automobiles or other items.
- The White House officially announced a one-month tariff exemption for automobiles imported from Canada and Mexico.
- Markets view Germany's establishment of a €500 billion special fund and its attempt to ease the "debt limit" as a historic shift.
- In Australia, the Q4 growth rate hit its highest level in two years, with annual GDP growth recovering slightly to 1.3% last year. The Reserve Bank of Australia (RBA) projects GDP growth will rise to 2.4% this year.
Key Economic Events This Week
+ March 6: ECB Interest Rate Decision
+ March 7: U.S. February Nonfarm Payrolls, Unemployment Rate, Fed Chair Powell's Speech
AUDUSD Chart Analysis
The pair previously faced strong resistance at the 0.64000 level, leading to a significant pullback. It now appears to be making another attempt to break through this resistance. If the 0.64000 level is successfully breached, the price is expected to rise toward 0.66000. However, if it fails to break resistance, a decline toward the 0.60000 level is likely.

AUD/USD Update - Correction Then Continue "LONG"How I see it:
78.60% FIB @ 0.63607
Potential Correction - "SHORT"
TP 1 = 0.62550
and / or
If key support @ 62350 Holds - Continue "LONG"
TP 1 = 0.64080
Keynote:
Pair shows quality bullish strength at this time.
Price can also just power on to 0.64000 or beyond, with only minor dips
until a key resistance is reached.
This will indicate a much higher TF FIB is required.
I will update and calibrate as required.
Thank you for taking the time to study my analysis.

AUD/USD - Austrailian Dollar / US Dollar 2/27/2025Fundamental Context
The Australian dollar held its recent decline to around $0.63 on Thursday, hovering at a two-week low as US President Donald Trump’s latest tariff escalation weighed on risk sentiment. On Wednesday, Trump outlined plans for 25% “reciprocal” tariffs on European autos and other goods, while confirming that tariffs on Mexico and Canada would take effect on April 2, rather than the previously set deadline of March 4. Given Australia’s heavy reliance on exports, the currency remains vulnerable to the risks of a global trade war. Domestic data also showed an unexpected decline in private capital expenditure for the fourth quarter, fueling expectations of further interest rate cuts by the Reserve Bank of Australia. However, RBA Deputy Governor Andrew Hauser said on Thursday that the central bank would need to see more positive inflation data before considering additional rate cuts.
Technical Overview
Support Zones
First Major Support around 0.6200 – Price is currently hovering around this psychological level. A bounce here could trigger short-term recovery, but failure to hold suggests deeper downside.
Secondary Support around 0.5950–0.5910 – Historical support, providing a deeper line of defense for buyers.
Tertiary Support around 0.5650–0.5600 – A key zone visible from prior cycle lows.
Buy Limit Orders
The chart highlights staggered buy-limit levels within these support zones, suggesting a strategy to average into long positions if the Aussie continues to weaken.
BLO 1 @ 0.61939
BLO 2 @ 0.59172
BLO 3 @ 0.56378
Take-Profit Targets (TP)
TP1 @ 0.63741
TP2 @ 0.66979
TP3 @ 0.71315

Long IdeaBullish shift. Re-tracement completed at this zone or potentially further into 2nd zone. Price generating confirmation at this level and therefore a buy could be a possibility this week for higher prices.
Safe & Happy trades.

Bearish reversal off overlap resistance?AUD/USD is rising towards the resistance level which is an overlap resistance that is slightly above the 61.8% Fibonacci retracement and could reverse from this level to our take profit.
Entry: 0.6331
Why we like it:
There is an overlap resistance level that is slightly above the 61.8% Fibonacci retracement.
Stop loss: 0.6408
Why we like it:
There is a pullback resistance level.
Take profit: 0.6260
Why we like it:
There is a pullback support level that aligns with the 50% Fibonacci retracement.
Enjoying your TradingView experience? Review us!
Please be advised that the information presented on TradingView is provided to Vantage (‘Vantage Global Limited’, ‘we’) by a third-party provider (‘Everest Fortune Group’). Please be reminded that you are solely responsible for the trading decisions on your account. There is a very high degree of risk involved in trading. Any information and/or content is intended entirely for research, educational and informational purposes only and does not constitute investment or consultation advice or investment strategy. The information is not tailored to the investment needs of any specific person and therefore does not involve a consideration of any of the investment objectives, financial situation or needs of any viewer that may receive it. Kindly also note that past performance is not a reliable indicator of future results. Actual results may differ materially from those anticipated in forward-looking or past performance statements. We assume no liability as to the accuracy or completeness of any of the information and/or content provided herein and the Company cannot be held responsible for any omission, mistake nor for any loss or damage including without limitation to any loss of profit which may arise from reliance on any information supplied by Everest Fortune Group.

AUDUSD Buy IdeaAUDUSD is showing bullish reversals on the 4H and 1D time frames. Look for a pullback to take a buy entry or look for the breakout of the next resistance zone to take an entry.

Trendline BreakThe price Broke a trendline and made a pullback, now the price looks to go long after making a higher high, let the impulse start
WE ONLY TRADE PULBACKS

Support and ResistanceGood day traders, lets take a look at AUDUSD. as you can see in the setup above we are looking to go long on AUDUSD and this is based on the fact that price reached a strong all time yearly support and basics say buy at support and sell at resistance , the long decision is based on other technical analysis and pair correlations, please scale down and find entries that accommodate your trading accounts.

Daily AU Updates March 5th 2025Hello Traders! I had to correct the IPDA Look Back Data Range. Other than that Dollar is still bearish and xxx/USD pairs are bullish. I would avoid trading Thursday and Friday (NFP).

AUDUSD - Bullish Continuation Toward 0.63160OANDA:AUDUSD has broken above a key resistance zone, which has now flipped to support, aligning with a potential bullish continuation. The recent retest of this level held successfully, indicating strong buyer interest and reinforcing the bullish outlook.
With momentum favoring the upside, the price could move upward toward the 0.63160 level, which represents a logical target within the current market structure. As long as the price remains above the support level, the bullish bias stays intact.
If you agree with this analysis or have additional insights, feel free to share your thoughts here!

AUDUSD LONG TRADE IDEA📈 AUDUSD Buy Setup – Model 2 in Action! 🚀
I'm anticipating a BUY on AUDUSD based on my Model 2 strategy: SH + BOS + IDM + PDA. The market structure is aligning perfectly, and this setup is looking 🔥!
Will you be taking this trade? Let me know your thoughts in the comments! 💬👇
📌 Like, share, and drop your opinions below – let’s analyze together! 🚀📊
#ForexTrading #AUDUSD #TradingStrategy #MarketAnalysis
AUD/USD For Bullishwait for entry point as pull-back and then go long
general trend is down
current phase is pull-back
have fun :)

AUDUSD H4 LongRemember, successful trading relies on proper risk management and a disciplined approach. Use stop-losses to safeguard your assets and carefully plan each trade. Analysis is the key to making informed decisions. Stay updated and continue refining your strategies!

Australian GDP beats forecast, Aussie edges higherThe Australian dollar has extended its gains on Wednesday. AUD/USD is trading at 0.6271 in the European session, up 0.20% on the day. The Australian dollar jumped 0.75% on Tuesday, driven by the hawkish Reserve Bank of Australia minutes and a solid retail sales report.
Australia's economy expanded by 1.3% y/y in the fourth quarter of 2024, up from 0.8% in Q3 and above the market estimate of 1.2% and the RBA's forecast of 1.1%. This marked the fastest pace of growth since Q4 2023.
Quarterly, GDP grew by 0.6%, following 0.3% in Q3 and higher than the market estimate of 0.5%. This was the fastest pace of growth since Q4 2022. The strong gain was driven by strong increases in household spending and exports.
The positive GDP report follows last week's rate cut, after the central bank held rates for over a year. The cash rate is currently at 4.10%, its lowest level since Oct. 2023. The RBA has remained hawkish, even with the rate cut. The minutes of the meeting stated that members remained concerned that further cuts could jeopardize maintaining inflation in the target range of 2%-3%.
The markets are more dovish and expect the cash rate to fall to 3.6% by the end of the year, which would mean two more cuts of 25 basis points. The central bank's rate path will largely depend on the inflation levels as well as the strength of the labor market, which has been surprisingly robust despite high interest rates and a weak economy.
In China, this week's PMIs are pointing to slightly stronger growth. The Caixin Manufacturing PMI for February improved to 50.8, up from 50.1 in January and above the market estimate of 50.3. The Caixin Services PMI rose to 51.4, up from 51.0 in January and above the market estimate of 50.8.
AUD/USD is testing resistance at 0.6228. Above, there is resistance at 0.6251
0.6200 and 0.6177 are providing support

AUDUSD Top-down analysis Hello traders, this is a complete multiple timeframe analysis of this pair. We see could find significant trading opportunities as per analysis upon price action confirmation we may take this trade. Smash the like button if you find value in this analysis and drop a comment if you have any questions or let me know which pair to cover in my next analysis.
